Immigrants from Bulgaria vs Australian Median Female Earnings
COMPARE
Immigrants from Bulgaria
Australian
Median Female Earnings
Median Female Earnings Comparison
Immigrants from Bulgaria
Australians
$43,085
MEDIAN FEMALE EARNINGS
99.9/ 100
METRIC RATING
61st/ 347
METRIC RANK
$43,308
MEDIAN FEMALE EARNINGS
99.9/ 100
METRIC RATING
54th/ 347
METRIC RANK
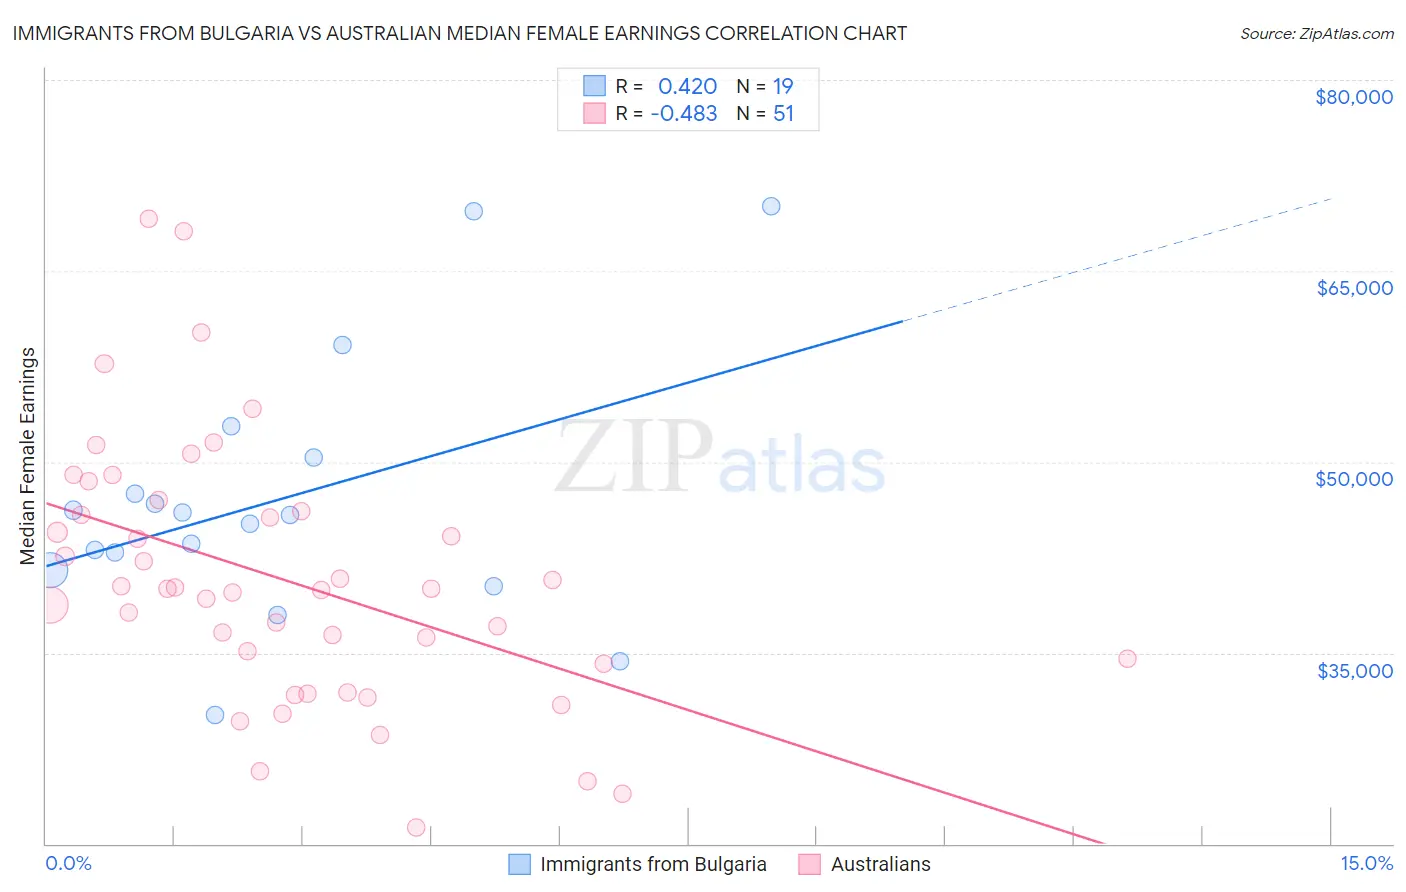
Immigrants from Bulgaria vs Australian Median Female Earnings Correlation Chart
The statistical analysis conducted on geographies consisting of 172,533,051 people shows a moderate positive correlation between the proportion of Immigrants from Bulgaria and median female earnings in the United States with a correlation coefficient (R) of 0.420 and weighted average of $43,085. Similarly, the statistical analysis conducted on geographies consisting of 224,101,413 people shows a moderate negative correlation between the proportion of Australians and median female earnings in the United States with a correlation coefficient (R) of -0.483 and weighted average of $43,308, a difference of 0.52%.
Median Female Earnings Correlation Summary
| Measurement | Immigrants from Bulgaria | Australian |
| Minimum | $30,131 | $21,275 |
| Maximum | $70,060 | $69,107 |
| Range | $39,929 | $47,832 |
| Mean | $47,007 | $40,748 |
| Median | $45,854 | $40,021 |
| Interquartile 25% (IQ1) | $41,489 | $34,140 |
| Interquartile 75% (IQ3) | $50,302 | $46,088 |
| Interquartile Range (IQR) | $8,813 | $11,949 |
| Standard Deviation (Sample) | $10,260 | $10,236 |
| Standard Deviation (Population) | $9,987 | $10,135 |
Demographics Similar to Immigrants from Bulgaria and Australians by Median Female Earnings
In terms of median female earnings, the demographic groups most similar to Immigrants from Bulgaria are Afghan ($43,077, a difference of 0.020%), Immigrants from Latvia ($43,099, a difference of 0.030%), Immigrants from Ukraine ($43,069, a difference of 0.040%), Estonian ($43,106, a difference of 0.050%), and Immigrants from Pakistan ($43,052, a difference of 0.080%). Similarly, the demographic groups most similar to Australians are Immigrants from Eastern Europe ($43,309, a difference of 0.0%), Egyptian ($43,305, a difference of 0.010%), Immigrants from Lithuania ($43,317, a difference of 0.020%), Maltese ($43,357, a difference of 0.11%), and Immigrants from Croatia ($43,258, a difference of 0.11%).
| Demographics | Rating | Rank | Median Female Earnings |
| Bolivians | 100.0 /100 | #47 | Exceptional $43,445 |
| Immigrants | Indonesia | 100.0 /100 | #48 | Exceptional $43,412 |
| Immigrants | Serbia | 100.0 /100 | #49 | Exceptional $43,385 |
| Immigrants | Uzbekistan | 100.0 /100 | #50 | Exceptional $43,363 |
| Maltese | 100.0 /100 | #51 | Exceptional $43,357 |
| Immigrants | Lithuania | 99.9 /100 | #52 | Exceptional $43,317 |
| Immigrants | Eastern Europe | 99.9 /100 | #53 | Exceptional $43,309 |
| Australians | 99.9 /100 | #54 | Exceptional $43,308 |
| Egyptians | 99.9 /100 | #55 | Exceptional $43,305 |
| Immigrants | Croatia | 99.9 /100 | #56 | Exceptional $43,258 |
| Ethiopians | 99.9 /100 | #57 | Exceptional $43,243 |
| Paraguayans | 99.9 /100 | #58 | Exceptional $43,173 |
| Estonians | 99.9 /100 | #59 | Exceptional $43,106 |
| Immigrants | Latvia | 99.9 /100 | #60 | Exceptional $43,099 |
| Immigrants | Bulgaria | 99.9 /100 | #61 | Exceptional $43,085 |
| Afghans | 99.9 /100 | #62 | Exceptional $43,077 |
| Immigrants | Ukraine | 99.9 /100 | #63 | Exceptional $43,069 |
| Immigrants | Pakistan | 99.9 /100 | #64 | Exceptional $43,052 |
| Sierra Leoneans | 99.9 /100 | #65 | Exceptional $42,868 |
| Immigrants | Norway | 99.9 /100 | #66 | Exceptional $42,837 |
| Immigrants | Egypt | 99.9 /100 | #67 | Exceptional $42,837 |