Thai vs Sudanese Median Household Income
COMPARE
Thai
Sudanese
Median Household Income
Median Household Income Comparison
Thais
Sudanese
$110,648
MEDIAN HOUSEHOLD INCOME
100.0/ 100
METRIC RATING
5th/ 347
METRIC RANK
$78,529
MEDIAN HOUSEHOLD INCOME
1.5/ 100
METRIC RATING
248th/ 347
METRIC RANK
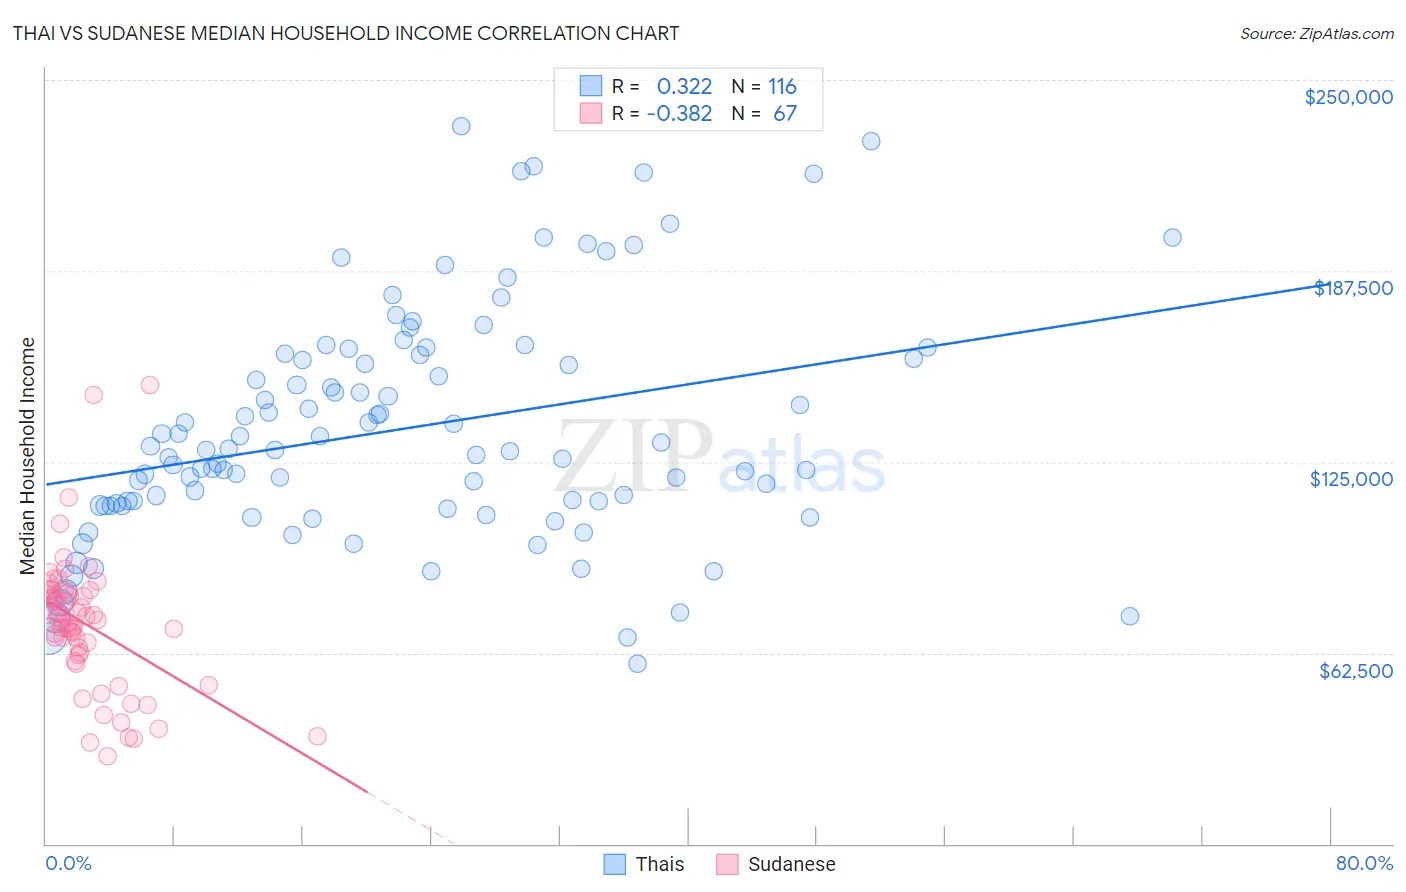
Thai vs Sudanese Median Household Income Correlation Chart
The statistical analysis conducted on geographies consisting of 475,225,518 people shows a mild positive correlation between the proportion of Thais and median household income in the United States with a correlation coefficient (R) of 0.322 and weighted average of $110,648. Similarly, the statistical analysis conducted on geographies consisting of 110,096,720 people shows a mild negative correlation between the proportion of Sudanese and median household income in the United States with a correlation coefficient (R) of -0.382 and weighted average of $78,529, a difference of 40.9%.
Median Household Income Correlation Summary
| Measurement | Thai | Sudanese |
| Minimum | $58,750 | $28,750 |
| Maximum | $235,000 | $150,237 |
| Range | $176,250 | $121,487 |
| Mean | $135,684 | $71,874 |
| Median | $129,000 | $73,369 |
| Interquartile 25% (IQ1) | $110,676 | $61,639 |
| Interquartile 75% (IQ3) | $159,273 | $82,076 |
| Interquartile Range (IQR) | $48,596 | $20,437 |
| Standard Deviation (Sample) | $37,863 | $22,253 |
| Standard Deviation (Population) | $37,700 | $22,086 |
Similar Demographics by Median Household Income
Demographics Similar to Thais by Median Household Income
In terms of median household income, the demographic groups most similar to Thais are Immigrants from Singapore ($110,428, a difference of 0.20%), Iranian ($109,835, a difference of 0.74%), Immigrants from Hong Kong ($111,519, a difference of 0.79%), Immigrants from India ($113,009, a difference of 2.1%), and Immigrants from Iran ($108,055, a difference of 2.4%).
| Demographics | Rating | Rank | Median Household Income |
| Immigrants | Taiwan | 100.0 /100 | #1 | Exceptional $116,460 |
| Filipinos | 100.0 /100 | #2 | Exceptional $115,509 |
| Immigrants | India | 100.0 /100 | #3 | Exceptional $113,009 |
| Immigrants | Hong Kong | 100.0 /100 | #4 | Exceptional $111,519 |
| Thais | 100.0 /100 | #5 | Exceptional $110,648 |
| Immigrants | Singapore | 100.0 /100 | #6 | Exceptional $110,428 |
| Iranians | 100.0 /100 | #7 | Exceptional $109,835 |
| Immigrants | Iran | 100.0 /100 | #8 | Exceptional $108,055 |
| Okinawans | 100.0 /100 | #9 | Exceptional $106,624 |
| Immigrants | South Central Asia | 100.0 /100 | #10 | Exceptional $106,057 |
| Immigrants | China | 100.0 /100 | #11 | Exceptional $105,335 |
| Indians (Asian) | 100.0 /100 | #12 | Exceptional $105,262 |
| Immigrants | Eastern Asia | 100.0 /100 | #13 | Exceptional $104,796 |
| Immigrants | Ireland | 100.0 /100 | #14 | Exceptional $104,692 |
| Immigrants | Israel | 100.0 /100 | #15 | Exceptional $104,090 |
Demographics Similar to Sudanese by Median Household Income
In terms of median household income, the demographic groups most similar to Sudanese are West Indian ($78,455, a difference of 0.090%), Immigrants from Burma/Myanmar ($78,682, a difference of 0.19%), Immigrants from Laos ($78,327, a difference of 0.26%), Central American ($78,803, a difference of 0.35%), and Inupiat ($78,841, a difference of 0.40%).
| Demographics | Rating | Rank | Median Household Income |
| Immigrants | Nonimmigrants | 2.6 /100 | #241 | Tragic $79,429 |
| Immigrants | Sudan | 2.1 /100 | #242 | Tragic $79,103 |
| Immigrants | Barbados | 1.9 /100 | #243 | Tragic $78,989 |
| Marshallese | 1.9 /100 | #244 | Tragic $78,930 |
| Inupiat | 1.8 /100 | #245 | Tragic $78,841 |
| Central Americans | 1.7 /100 | #246 | Tragic $78,803 |
| Immigrants | Burma/Myanmar | 1.6 /100 | #247 | Tragic $78,682 |
| Sudanese | 1.5 /100 | #248 | Tragic $78,529 |
| West Indians | 1.4 /100 | #249 | Tragic $78,455 |
| Immigrants | Laos | 1.3 /100 | #250 | Tragic $78,327 |
| Mexican American Indians | 1.2 /100 | #251 | Tragic $78,166 |
| Immigrants | West Indies | 1.0 /100 | #252 | Tragic $77,956 |
| Immigrants | St. Vincent and the Grenadines | 0.9 /100 | #253 | Tragic $77,690 |
| Sub-Saharan Africans | 0.8 /100 | #254 | Tragic $77,631 |
| Immigrants | Middle Africa | 0.8 /100 | #255 | Tragic $77,559 |