Thai vs Palestinian Median Household Income
COMPARE
Thai
Palestinian
Median Household Income
Median Household Income Comparison
Thais
Palestinians
$110,648
MEDIAN HOUSEHOLD INCOME
100.0/ 100
METRIC RATING
5th/ 347
METRIC RANK
$90,574
MEDIAN HOUSEHOLD INCOME
97.1/ 100
METRIC RATING
110th/ 347
METRIC RANK
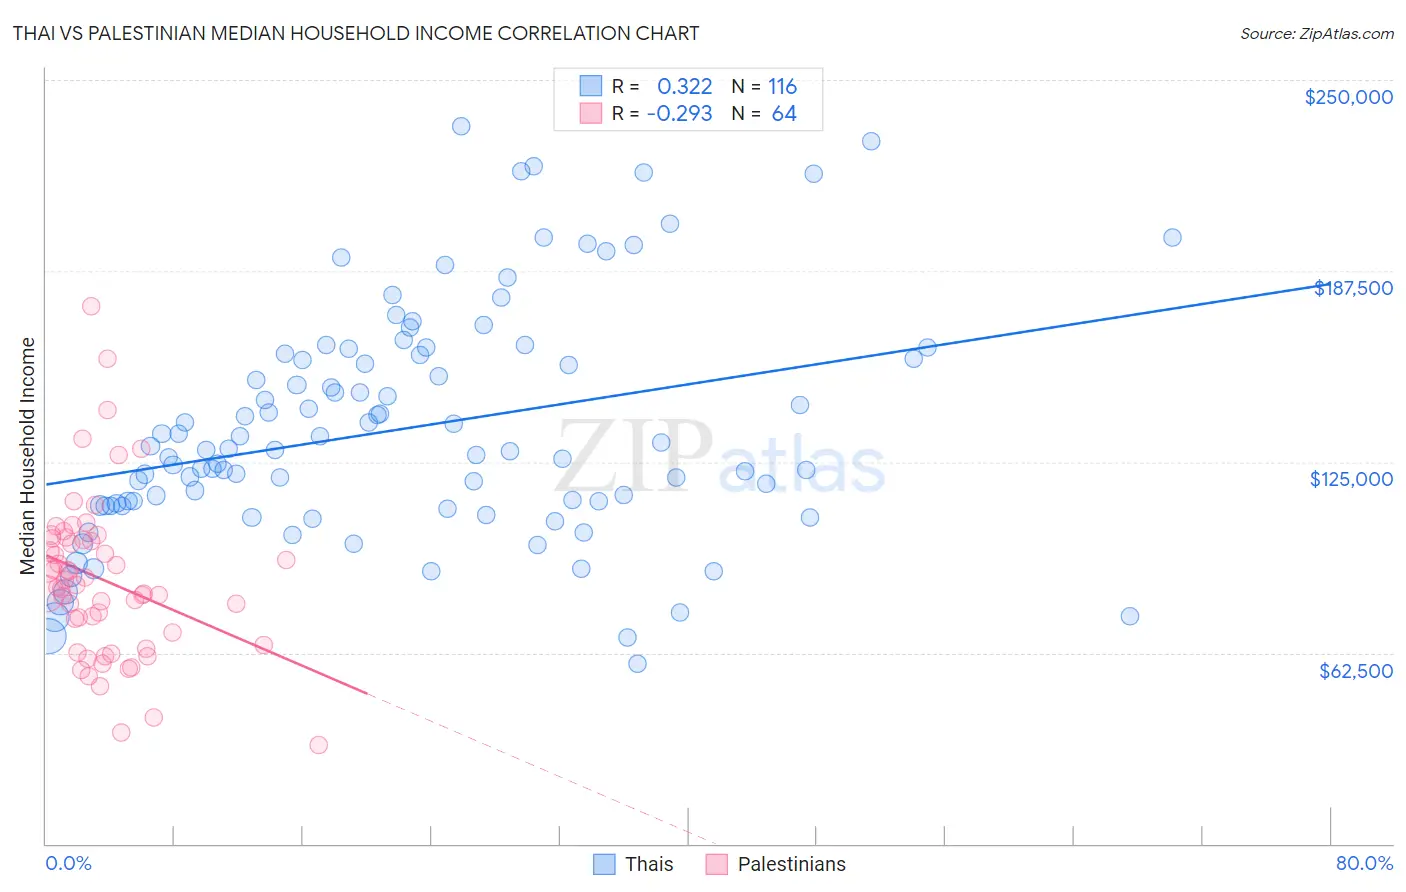
Thai vs Palestinian Median Household Income Correlation Chart
The statistical analysis conducted on geographies consisting of 475,225,518 people shows a mild positive correlation between the proportion of Thais and median household income in the United States with a correlation coefficient (R) of 0.322 and weighted average of $110,648. Similarly, the statistical analysis conducted on geographies consisting of 216,355,198 people shows a weak negative correlation between the proportion of Palestinians and median household income in the United States with a correlation coefficient (R) of -0.293 and weighted average of $90,574, a difference of 22.2%.
Median Household Income Correlation Summary
| Measurement | Thai | Palestinian |
| Minimum | $58,750 | $32,375 |
| Maximum | $235,000 | $176,058 |
| Range | $176,250 | $143,683 |
| Mean | $135,684 | $86,299 |
| Median | $129,000 | $84,304 |
| Interquartile 25% (IQ1) | $110,676 | $67,018 |
| Interquartile 75% (IQ3) | $159,273 | $99,711 |
| Interquartile Range (IQR) | $48,596 | $32,693 |
| Standard Deviation (Sample) | $37,863 | $26,509 |
| Standard Deviation (Population) | $37,700 | $26,301 |
Similar Demographics by Median Household Income
Demographics Similar to Thais by Median Household Income
In terms of median household income, the demographic groups most similar to Thais are Immigrants from Singapore ($110,428, a difference of 0.20%), Iranian ($109,835, a difference of 0.74%), Immigrants from Hong Kong ($111,519, a difference of 0.79%), Immigrants from India ($113,009, a difference of 2.1%), and Immigrants from Iran ($108,055, a difference of 2.4%).
| Demographics | Rating | Rank | Median Household Income |
| Immigrants | Taiwan | 100.0 /100 | #1 | Exceptional $116,460 |
| Filipinos | 100.0 /100 | #2 | Exceptional $115,509 |
| Immigrants | India | 100.0 /100 | #3 | Exceptional $113,009 |
| Immigrants | Hong Kong | 100.0 /100 | #4 | Exceptional $111,519 |
| Thais | 100.0 /100 | #5 | Exceptional $110,648 |
| Immigrants | Singapore | 100.0 /100 | #6 | Exceptional $110,428 |
| Iranians | 100.0 /100 | #7 | Exceptional $109,835 |
| Immigrants | Iran | 100.0 /100 | #8 | Exceptional $108,055 |
| Okinawans | 100.0 /100 | #9 | Exceptional $106,624 |
| Immigrants | South Central Asia | 100.0 /100 | #10 | Exceptional $106,057 |
| Immigrants | China | 100.0 /100 | #11 | Exceptional $105,335 |
| Indians (Asian) | 100.0 /100 | #12 | Exceptional $105,262 |
| Immigrants | Eastern Asia | 100.0 /100 | #13 | Exceptional $104,796 |
| Immigrants | Ireland | 100.0 /100 | #14 | Exceptional $104,692 |
| Immigrants | Israel | 100.0 /100 | #15 | Exceptional $104,090 |
Demographics Similar to Palestinians by Median Household Income
In terms of median household income, the demographic groups most similar to Palestinians are Chilean ($90,605, a difference of 0.030%), Immigrants from Poland ($90,549, a difference of 0.030%), Zimbabwean ($90,618, a difference of 0.050%), Croatian ($90,685, a difference of 0.12%), and Northern European ($90,446, a difference of 0.14%).
| Demographics | Rating | Rank | Median Household Income |
| Immigrants | Ukraine | 98.0 /100 | #103 | Exceptional $91,124 |
| Immigrants | Kazakhstan | 97.8 /100 | #104 | Exceptional $91,015 |
| Immigrants | Brazil | 97.7 /100 | #105 | Exceptional $90,907 |
| Macedonians | 97.4 /100 | #106 | Exceptional $90,761 |
| Croatians | 97.3 /100 | #107 | Exceptional $90,685 |
| Zimbabweans | 97.2 /100 | #108 | Exceptional $90,618 |
| Chileans | 97.2 /100 | #109 | Exceptional $90,605 |
| Palestinians | 97.1 /100 | #110 | Exceptional $90,574 |
| Immigrants | Poland | 97.1 /100 | #111 | Exceptional $90,549 |
| Northern Europeans | 96.9 /100 | #112 | Exceptional $90,446 |
| Peruvians | 96.5 /100 | #113 | Exceptional $90,261 |
| Immigrants | Northern Africa | 95.9 /100 | #114 | Exceptional $90,026 |
| Immigrants | Western Asia | 95.9 /100 | #115 | Exceptional $90,005 |
| Native Hawaiians | 95.7 /100 | #116 | Exceptional $89,919 |
| Taiwanese | 95.6 /100 | #117 | Exceptional $89,900 |