Czech vs Immigrants from Asia Median Household Income
COMPARE
Czech
Immigrants from Asia
Median Household Income
Median Household Income Comparison
Czechs
Immigrants from Asia
$86,164
MEDIAN HOUSEHOLD INCOME
66.4/ 100
METRIC RATING
163rd/ 347
METRIC RANK
$99,933
MEDIAN HOUSEHOLD INCOME
100.0/ 100
METRIC RATING
29th/ 347
METRIC RANK
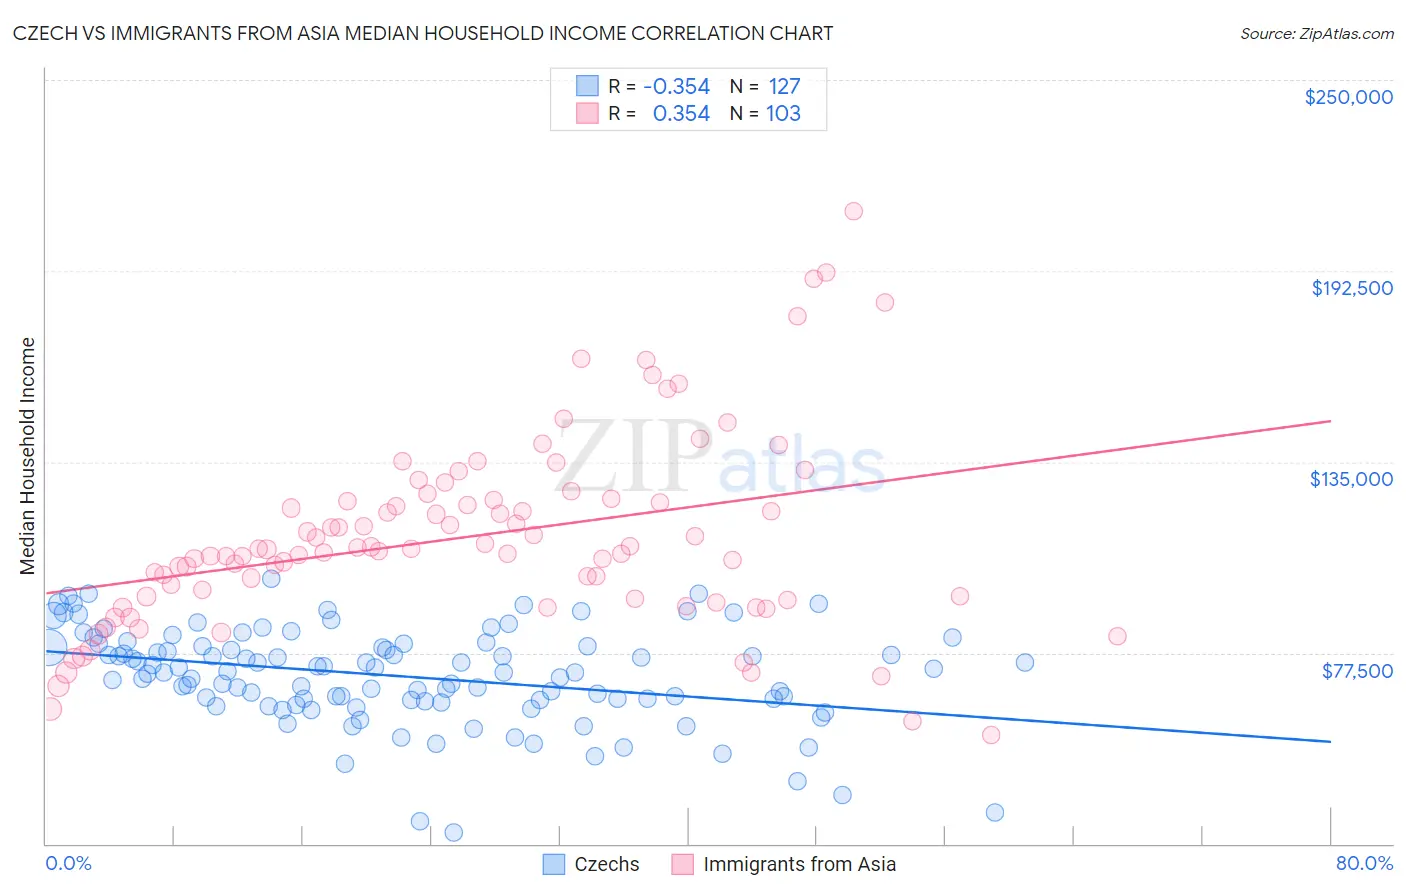
Czech vs Immigrants from Asia Median Household Income Correlation Chart
The statistical analysis conducted on geographies consisting of 484,294,688 people shows a mild negative correlation between the proportion of Czechs and median household income in the United States with a correlation coefficient (R) of -0.354 and weighted average of $86,164. Similarly, the statistical analysis conducted on geographies consisting of 548,273,530 people shows a mild positive correlation between the proportion of Immigrants from Asia and median household income in the United States with a correlation coefficient (R) of 0.354 and weighted average of $99,933, a difference of 16.0%.
Median Household Income Correlation Summary
| Measurement | Czech | Immigrants from Asia |
| Minimum | $23,393 | $52,658 |
| Maximum | $99,887 | $210,660 |
| Range | $76,494 | $158,002 |
| Mean | $70,465 | $112,443 |
| Median | $71,750 | $108,674 |
| Interquartile 25% (IQ1) | $63,125 | $93,690 |
| Interquartile 75% (IQ3) | $79,521 | $123,452 |
| Interquartile Range (IQR) | $16,396 | $29,762 |
| Standard Deviation (Sample) | $14,479 | $28,979 |
| Standard Deviation (Population) | $14,422 | $28,838 |
Similar Demographics by Median Household Income
Demographics Similar to Czechs by Median Household Income
In terms of median household income, the demographic groups most similar to Czechs are Irish ($86,145, a difference of 0.020%), Norwegian ($86,084, a difference of 0.090%), Guamanian/Chamorro ($86,255, a difference of 0.11%), Scandinavian ($86,073, a difference of 0.11%), and Slavic ($86,398, a difference of 0.27%).
| Demographics | Rating | Rank | Median Household Income |
| Immigrants | Albania | 71.5 /100 | #156 | Good $86,534 |
| Samoans | 71.0 /100 | #157 | Good $86,498 |
| Moroccans | 70.6 /100 | #158 | Good $86,468 |
| Immigrants | Uzbekistan | 70.1 /100 | #159 | Good $86,425 |
| Luxembourgers | 70.0 /100 | #160 | Good $86,418 |
| Slavs | 69.7 /100 | #161 | Good $86,398 |
| Guamanians/Chamorros | 67.7 /100 | #162 | Good $86,255 |
| Czechs | 66.4 /100 | #163 | Good $86,164 |
| Irish | 66.2 /100 | #164 | Good $86,145 |
| Norwegians | 65.3 /100 | #165 | Good $86,084 |
| Scandinavians | 65.1 /100 | #166 | Good $86,073 |
| Immigrants | Immigrants | 61.3 /100 | #167 | Good $85,818 |
| Icelanders | 61.0 /100 | #168 | Good $85,797 |
| Colombians | 59.7 /100 | #169 | Average $85,716 |
| Swiss | 59.2 /100 | #170 | Average $85,681 |
Demographics Similar to Immigrants from Asia by Median Household Income
In terms of median household income, the demographic groups most similar to Immigrants from Asia are Immigrants from Sri Lanka ($99,943, a difference of 0.010%), Immigrants from Northern Europe ($99,813, a difference of 0.12%), Bhutanese ($100,151, a difference of 0.22%), Immigrants from Belgium ($100,306, a difference of 0.37%), and Turkish ($99,389, a difference of 0.55%).
| Demographics | Rating | Rank | Median Household Income |
| Asians | 100.0 /100 | #22 | Exceptional $101,681 |
| Immigrants | Bolivia | 100.0 /100 | #23 | Exceptional $101,394 |
| Immigrants | Japan | 100.0 /100 | #24 | Exceptional $100,711 |
| Immigrants | Sweden | 100.0 /100 | #25 | Exceptional $100,699 |
| Immigrants | Belgium | 100.0 /100 | #26 | Exceptional $100,306 |
| Bhutanese | 100.0 /100 | #27 | Exceptional $100,151 |
| Immigrants | Sri Lanka | 100.0 /100 | #28 | Exceptional $99,943 |
| Immigrants | Asia | 100.0 /100 | #29 | Exceptional $99,933 |
| Immigrants | Northern Europe | 100.0 /100 | #30 | Exceptional $99,813 |
| Turks | 100.0 /100 | #31 | Exceptional $99,389 |
| Immigrants | Denmark | 100.0 /100 | #32 | Exceptional $98,510 |
| Chinese | 100.0 /100 | #33 | Exceptional $98,496 |
| Russians | 100.0 /100 | #34 | Exceptional $98,008 |
| Immigrants | Switzerland | 100.0 /100 | #35 | Exceptional $97,979 |
| Immigrants | Pakistan | 100.0 /100 | #36 | Exceptional $97,528 |