Swiss vs Immigrants from Caribbean Median Male Earnings
COMPARE
Swiss
Immigrants from Caribbean
Median Male Earnings
Median Male Earnings Comparison
Swiss
Immigrants from Caribbean
$55,731
MEDIAN MALE EARNINGS
77.1/ 100
METRIC RATING
150th/ 347
METRIC RANK
$46,193
MEDIAN MALE EARNINGS
0.0/ 100
METRIC RATING
316th/ 347
METRIC RANK
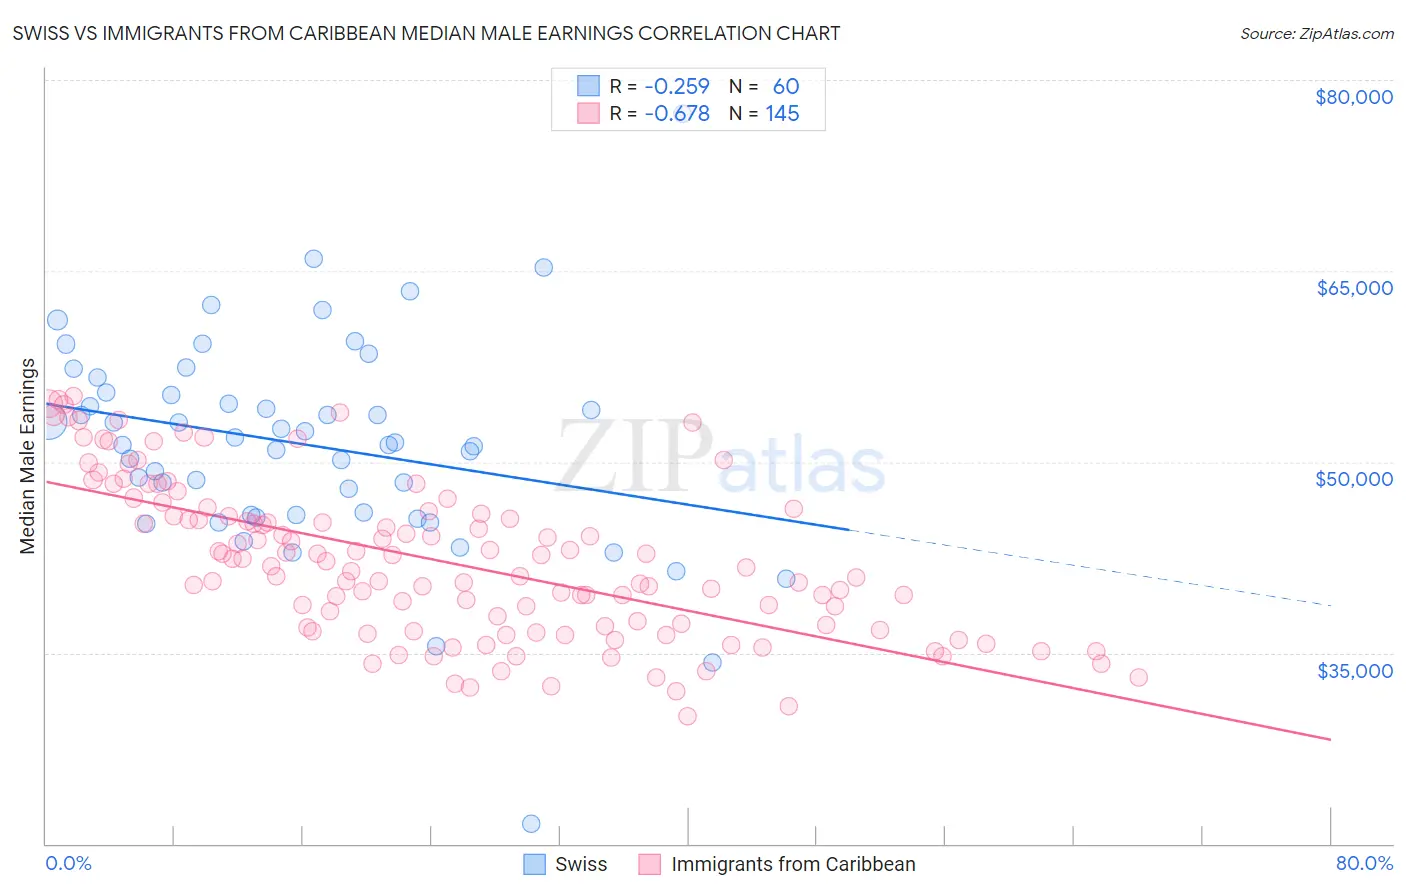
Swiss vs Immigrants from Caribbean Median Male Earnings Correlation Chart
The statistical analysis conducted on geographies consisting of 464,659,146 people shows a weak negative correlation between the proportion of Swiss and median male earnings in the United States with a correlation coefficient (R) of -0.259 and weighted average of $55,731. Similarly, the statistical analysis conducted on geographies consisting of 449,789,932 people shows a significant negative correlation between the proportion of Immigrants from Caribbean and median male earnings in the United States with a correlation coefficient (R) of -0.678 and weighted average of $46,193, a difference of 20.6%.
Median Male Earnings Correlation Summary
| Measurement | Swiss | Immigrants from Caribbean |
| Minimum | $21,563 | $30,010 |
| Maximum | $77,386 | $55,142 |
| Range | $55,823 | $25,132 |
| Mean | $51,336 | $42,215 |
| Median | $51,444 | $41,809 |
| Interquartile 25% (IQ1) | $45,855 | $37,054 |
| Interquartile 75% (IQ3) | $55,388 | $46,037 |
| Interquartile Range (IQR) | $9,533 | $8,984 |
| Standard Deviation (Sample) | $8,461 | $6,100 |
| Standard Deviation (Population) | $8,390 | $6,079 |
Similar Demographics by Median Male Earnings
Demographics Similar to Swiss by Median Male Earnings
In terms of median male earnings, the demographic groups most similar to Swiss are English ($55,747, a difference of 0.030%), Immigrants from Oceania ($55,712, a difference of 0.030%), Scottish ($55,793, a difference of 0.11%), Peruvian ($55,659, a difference of 0.13%), and Immigrants from Philippines ($55,809, a difference of 0.14%).
| Demographics | Rating | Rank | Median Male Earnings |
| Sri Lankans | 83.4 /100 | #143 | Excellent $56,136 |
| Immigrants | Uganda | 82.4 /100 | #144 | Excellent $56,064 |
| Norwegians | 80.9 /100 | #145 | Excellent $55,965 |
| Immigrants | Chile | 80.7 /100 | #146 | Excellent $55,954 |
| Immigrants | Philippines | 78.4 /100 | #147 | Good $55,809 |
| Scottish | 78.2 /100 | #148 | Good $55,793 |
| English | 77.4 /100 | #149 | Good $55,747 |
| Swiss | 77.1 /100 | #150 | Good $55,731 |
| Immigrants | Oceania | 76.8 /100 | #151 | Good $55,712 |
| Peruvians | 75.8 /100 | #152 | Good $55,659 |
| Immigrants | Nepal | 75.0 /100 | #153 | Good $55,615 |
| Taiwanese | 73.9 /100 | #154 | Good $55,556 |
| Scandinavians | 73.4 /100 | #155 | Good $55,527 |
| Immigrants | Ethiopia | 71.6 /100 | #156 | Good $55,434 |
| Icelanders | 71.2 /100 | #157 | Good $55,415 |
Demographics Similar to Immigrants from Caribbean by Median Male Earnings
In terms of median male earnings, the demographic groups most similar to Immigrants from Caribbean are Mexican ($46,147, a difference of 0.10%), Immigrants from Guatemala ($46,244, a difference of 0.11%), Cheyenne ($46,062, a difference of 0.28%), Chippewa ($46,368, a difference of 0.38%), and Honduran ($46,374, a difference of 0.39%).
| Demographics | Rating | Rank | Median Male Earnings |
| Creek | 0.0 /100 | #309 | Tragic $46,594 |
| Cubans | 0.0 /100 | #310 | Tragic $46,580 |
| Apache | 0.0 /100 | #311 | Tragic $46,429 |
| Hispanics or Latinos | 0.0 /100 | #312 | Tragic $46,419 |
| Hondurans | 0.0 /100 | #313 | Tragic $46,374 |
| Chippewa | 0.0 /100 | #314 | Tragic $46,368 |
| Immigrants | Guatemala | 0.0 /100 | #315 | Tragic $46,244 |
| Immigrants | Caribbean | 0.0 /100 | #316 | Tragic $46,193 |
| Mexicans | 0.0 /100 | #317 | Tragic $46,147 |
| Cheyenne | 0.0 /100 | #318 | Tragic $46,062 |
| Haitians | 0.0 /100 | #319 | Tragic $45,903 |
| Immigrants | Honduras | 0.0 /100 | #320 | Tragic $45,787 |
| Fijians | 0.0 /100 | #321 | Tragic $45,607 |
| Sioux | 0.0 /100 | #322 | Tragic $45,566 |
| Immigrants | Central America | 0.0 /100 | #323 | Tragic $45,538 |