Swiss vs Albanian Median Male Earnings
COMPARE
Swiss
Albanian
Median Male Earnings
Median Male Earnings Comparison
Swiss
Albanians
$55,731
MEDIAN MALE EARNINGS
77.1/ 100
METRIC RATING
150th/ 347
METRIC RANK
$58,680
MEDIAN MALE EARNINGS
98.4/ 100
METRIC RATING
96th/ 347
METRIC RANK
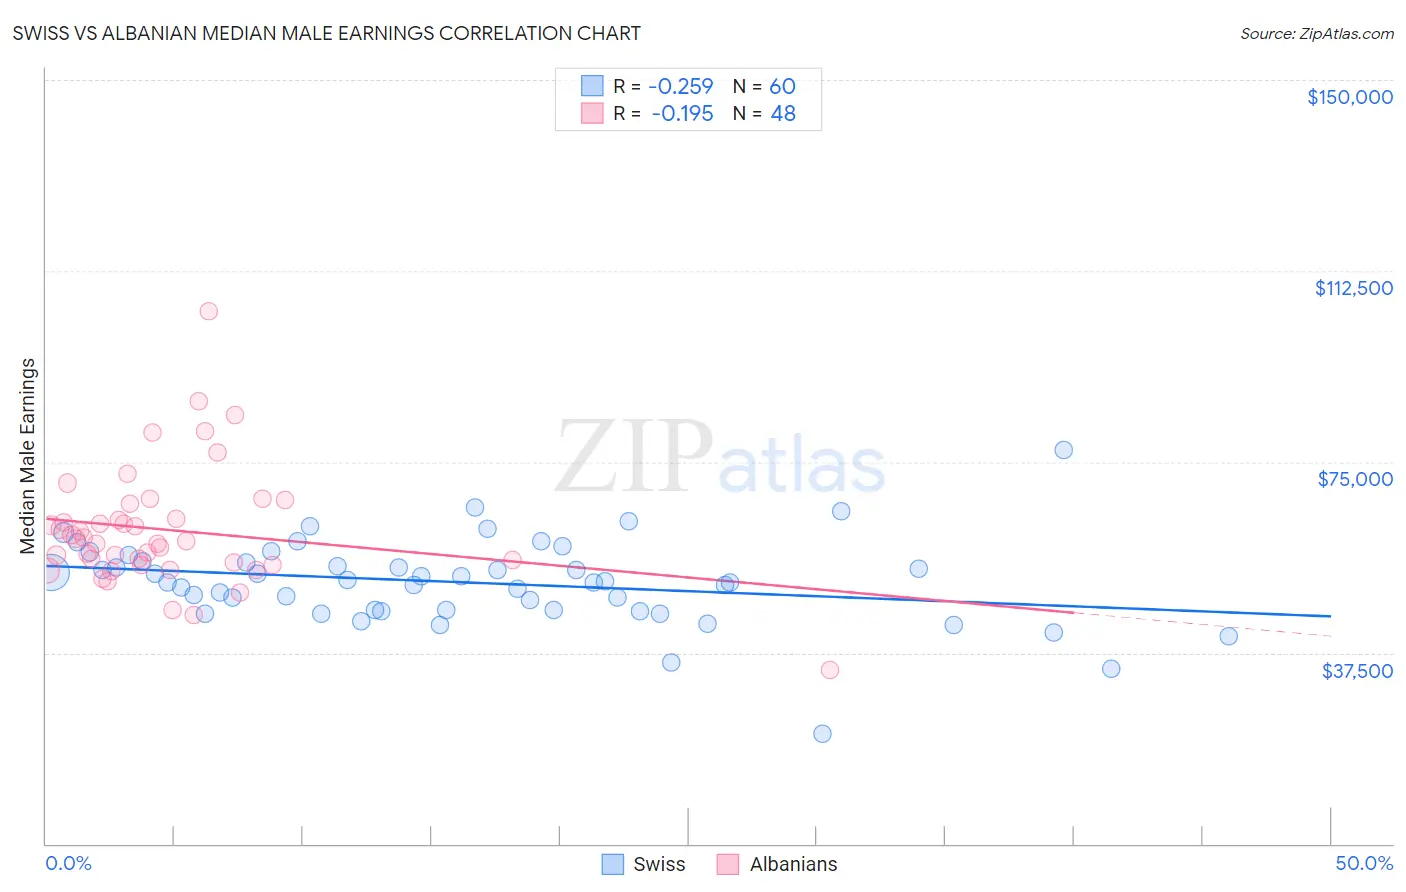
Swiss vs Albanian Median Male Earnings Correlation Chart
The statistical analysis conducted on geographies consisting of 464,659,146 people shows a weak negative correlation between the proportion of Swiss and median male earnings in the United States with a correlation coefficient (R) of -0.259 and weighted average of $55,731. Similarly, the statistical analysis conducted on geographies consisting of 193,234,421 people shows a poor negative correlation between the proportion of Albanians and median male earnings in the United States with a correlation coefficient (R) of -0.195 and weighted average of $58,680, a difference of 5.3%.
Median Male Earnings Correlation Summary
| Measurement | Swiss | Albanian |
| Minimum | $21,563 | $34,079 |
| Maximum | $77,386 | $104,479 |
| Range | $55,823 | $70,400 |
| Mean | $51,336 | $61,666 |
| Median | $51,444 | $59,610 |
| Interquartile 25% (IQ1) | $45,855 | $54,972 |
| Interquartile 75% (IQ3) | $55,388 | $65,262 |
| Interquartile Range (IQR) | $9,533 | $10,290 |
| Standard Deviation (Sample) | $8,461 | $11,807 |
| Standard Deviation (Population) | $8,390 | $11,684 |
Similar Demographics by Median Male Earnings
Demographics Similar to Swiss by Median Male Earnings
In terms of median male earnings, the demographic groups most similar to Swiss are English ($55,747, a difference of 0.030%), Immigrants from Oceania ($55,712, a difference of 0.030%), Scottish ($55,793, a difference of 0.11%), Peruvian ($55,659, a difference of 0.13%), and Immigrants from Philippines ($55,809, a difference of 0.14%).
| Demographics | Rating | Rank | Median Male Earnings |
| Sri Lankans | 83.4 /100 | #143 | Excellent $56,136 |
| Immigrants | Uganda | 82.4 /100 | #144 | Excellent $56,064 |
| Norwegians | 80.9 /100 | #145 | Excellent $55,965 |
| Immigrants | Chile | 80.7 /100 | #146 | Excellent $55,954 |
| Immigrants | Philippines | 78.4 /100 | #147 | Good $55,809 |
| Scottish | 78.2 /100 | #148 | Good $55,793 |
| English | 77.4 /100 | #149 | Good $55,747 |
| Swiss | 77.1 /100 | #150 | Good $55,731 |
| Immigrants | Oceania | 76.8 /100 | #151 | Good $55,712 |
| Peruvians | 75.8 /100 | #152 | Good $55,659 |
| Immigrants | Nepal | 75.0 /100 | #153 | Good $55,615 |
| Taiwanese | 73.9 /100 | #154 | Good $55,556 |
| Scandinavians | 73.4 /100 | #155 | Good $55,527 |
| Immigrants | Ethiopia | 71.6 /100 | #156 | Good $55,434 |
| Icelanders | 71.2 /100 | #157 | Good $55,415 |
Demographics Similar to Albanians by Median Male Earnings
In terms of median male earnings, the demographic groups most similar to Albanians are Northern European ($58,588, a difference of 0.16%), Immigrants from Lebanon ($58,835, a difference of 0.27%), Jordanian ($58,500, a difference of 0.31%), Immigrants from Poland ($58,452, a difference of 0.39%), and Assyrian/Chaldean/Syriac ($58,437, a difference of 0.42%).
| Demographics | Rating | Rank | Median Male Earnings |
| Immigrants | Moldova | 99.2 /100 | #89 | Exceptional $59,417 |
| Austrians | 99.2 /100 | #90 | Exceptional $59,359 |
| Laotians | 99.2 /100 | #91 | Exceptional $59,351 |
| Immigrants | Kazakhstan | 99.1 /100 | #92 | Exceptional $59,278 |
| Immigrants | Southern Europe | 99.0 /100 | #93 | Exceptional $59,217 |
| Immigrants | North Macedonia | 99.0 /100 | #94 | Exceptional $59,189 |
| Immigrants | Lebanon | 98.6 /100 | #95 | Exceptional $58,835 |
| Albanians | 98.4 /100 | #96 | Exceptional $58,680 |
| Northern Europeans | 98.2 /100 | #97 | Exceptional $58,588 |
| Jordanians | 98.1 /100 | #98 | Exceptional $58,500 |
| Immigrants | Poland | 98.0 /100 | #99 | Exceptional $58,452 |
| Assyrians/Chaldeans/Syriacs | 97.9 /100 | #100 | Exceptional $58,437 |
| Immigrants | Brazil | 97.7 /100 | #101 | Exceptional $58,324 |
| Syrians | 97.4 /100 | #102 | Exceptional $58,187 |
| Poles | 97.3 /100 | #103 | Exceptional $58,139 |