Spaniard vs Immigrants from Caribbean Median Male Earnings
COMPARE
Spaniard
Immigrants from Caribbean
Median Male Earnings
Median Male Earnings Comparison
Spaniards
Immigrants from Caribbean
$54,401
MEDIAN MALE EARNINGS
47.8/ 100
METRIC RATING
176th/ 347
METRIC RANK
$46,193
MEDIAN MALE EARNINGS
0.0/ 100
METRIC RATING
316th/ 347
METRIC RANK
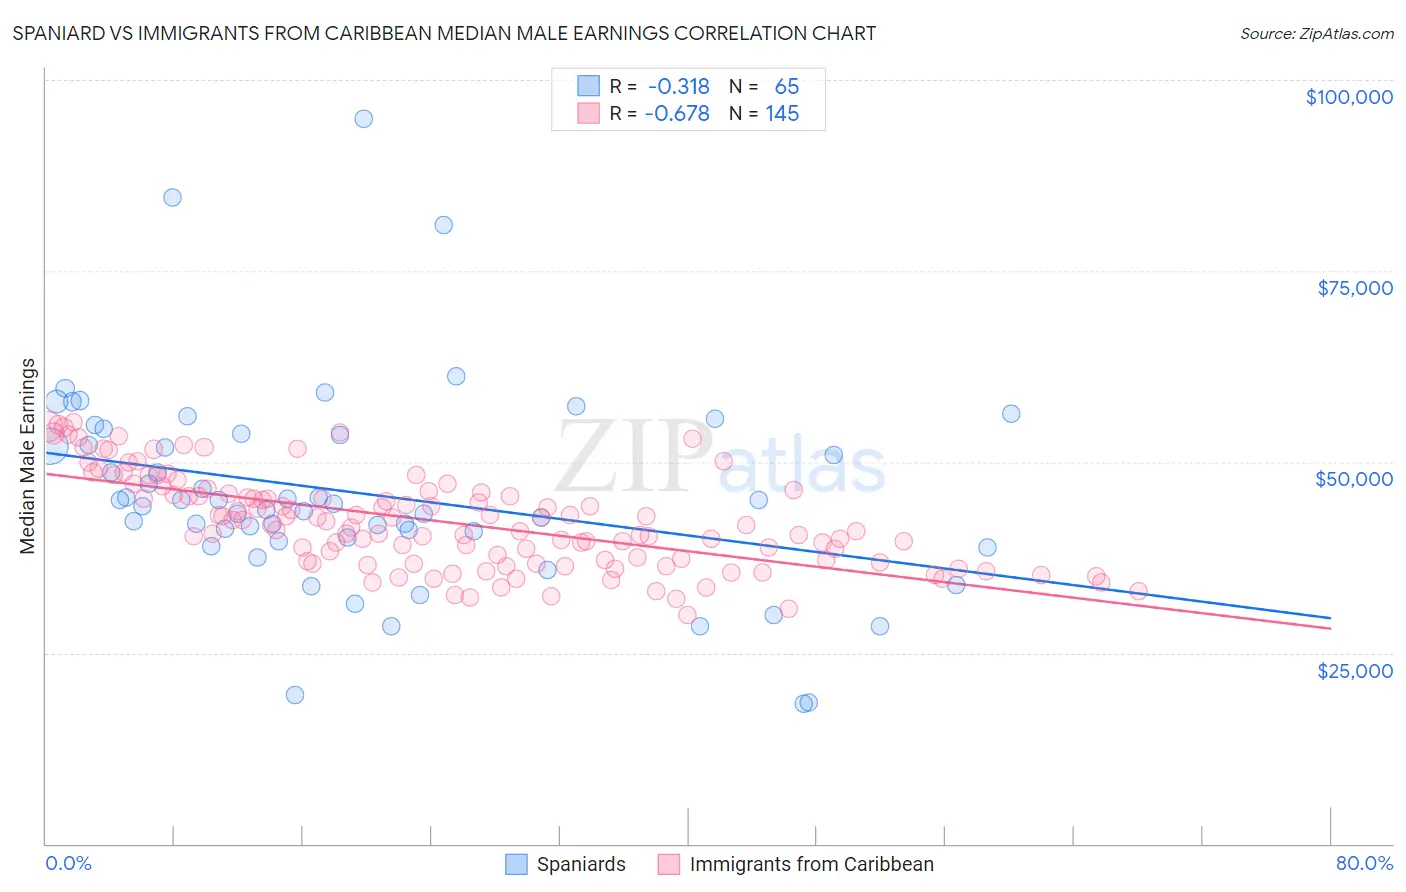
Spaniard vs Immigrants from Caribbean Median Male Earnings Correlation Chart
The statistical analysis conducted on geographies consisting of 443,330,517 people shows a mild negative correlation between the proportion of Spaniards and median male earnings in the United States with a correlation coefficient (R) of -0.318 and weighted average of $54,401. Similarly, the statistical analysis conducted on geographies consisting of 449,789,932 people shows a significant negative correlation between the proportion of Immigrants from Caribbean and median male earnings in the United States with a correlation coefficient (R) of -0.678 and weighted average of $46,193, a difference of 17.8%.
Median Male Earnings Correlation Summary
| Measurement | Spaniard | Immigrants from Caribbean |
| Minimum | $18,319 | $30,010 |
| Maximum | $95,000 | $55,142 |
| Range | $76,681 | $25,132 |
| Mean | $45,902 | $42,215 |
| Median | $44,474 | $41,809 |
| Interquartile 25% (IQ1) | $39,886 | $37,054 |
| Interquartile 75% (IQ3) | $53,625 | $46,037 |
| Interquartile Range (IQR) | $13,740 | $8,984 |
| Standard Deviation (Sample) | $13,482 | $6,100 |
| Standard Deviation (Population) | $13,378 | $6,079 |
Similar Demographics by Median Male Earnings
Demographics Similar to Spaniards by Median Male Earnings
In terms of median male earnings, the demographic groups most similar to Spaniards are Dutch ($54,410, a difference of 0.020%), South American ($54,492, a difference of 0.17%), South American Indian ($54,508, a difference of 0.20%), Costa Rican ($54,279, a difference of 0.22%), and Sierra Leonean ($54,279, a difference of 0.22%).
| Demographics | Rating | Rank | Median Male Earnings |
| French Canadians | 55.6 /100 | #169 | Average $54,722 |
| Finns | 55.6 /100 | #170 | Average $54,721 |
| Immigrants | Peru | 54.9 /100 | #171 | Average $54,695 |
| Welsh | 53.8 /100 | #172 | Average $54,647 |
| South American Indians | 50.4 /100 | #173 | Average $54,508 |
| South Americans | 50.0 /100 | #174 | Average $54,492 |
| Dutch | 48.0 /100 | #175 | Average $54,410 |
| Spaniards | 47.8 /100 | #176 | Average $54,401 |
| Costa Ricans | 44.8 /100 | #177 | Average $54,279 |
| Sierra Leoneans | 44.8 /100 | #178 | Average $54,279 |
| Celtics | 43.9 /100 | #179 | Average $54,242 |
| Iraqis | 42.5 /100 | #180 | Average $54,182 |
| Immigrants | Immigrants | 42.1 /100 | #181 | Average $54,168 |
| Yugoslavians | 37.4 /100 | #182 | Fair $53,967 |
| Immigrants | South America | 37.3 /100 | #183 | Fair $53,962 |
Demographics Similar to Immigrants from Caribbean by Median Male Earnings
In terms of median male earnings, the demographic groups most similar to Immigrants from Caribbean are Mexican ($46,147, a difference of 0.10%), Immigrants from Guatemala ($46,244, a difference of 0.11%), Cheyenne ($46,062, a difference of 0.28%), Chippewa ($46,368, a difference of 0.38%), and Honduran ($46,374, a difference of 0.39%).
| Demographics | Rating | Rank | Median Male Earnings |
| Creek | 0.0 /100 | #309 | Tragic $46,594 |
| Cubans | 0.0 /100 | #310 | Tragic $46,580 |
| Apache | 0.0 /100 | #311 | Tragic $46,429 |
| Hispanics or Latinos | 0.0 /100 | #312 | Tragic $46,419 |
| Hondurans | 0.0 /100 | #313 | Tragic $46,374 |
| Chippewa | 0.0 /100 | #314 | Tragic $46,368 |
| Immigrants | Guatemala | 0.0 /100 | #315 | Tragic $46,244 |
| Immigrants | Caribbean | 0.0 /100 | #316 | Tragic $46,193 |
| Mexicans | 0.0 /100 | #317 | Tragic $46,147 |
| Cheyenne | 0.0 /100 | #318 | Tragic $46,062 |
| Haitians | 0.0 /100 | #319 | Tragic $45,903 |
| Immigrants | Honduras | 0.0 /100 | #320 | Tragic $45,787 |
| Fijians | 0.0 /100 | #321 | Tragic $45,607 |
| Sioux | 0.0 /100 | #322 | Tragic $45,566 |
| Immigrants | Central America | 0.0 /100 | #323 | Tragic $45,538 |