Swiss vs Honduran Median Household Income
COMPARE
Swiss
Honduran
Median Household Income
Median Household Income Comparison
Swiss
Hondurans
$85,681
MEDIAN HOUSEHOLD INCOME
59.2/ 100
METRIC RATING
170th/ 347
METRIC RANK
$72,588
MEDIAN HOUSEHOLD INCOME
0.0/ 100
METRIC RATING
305th/ 347
METRIC RANK
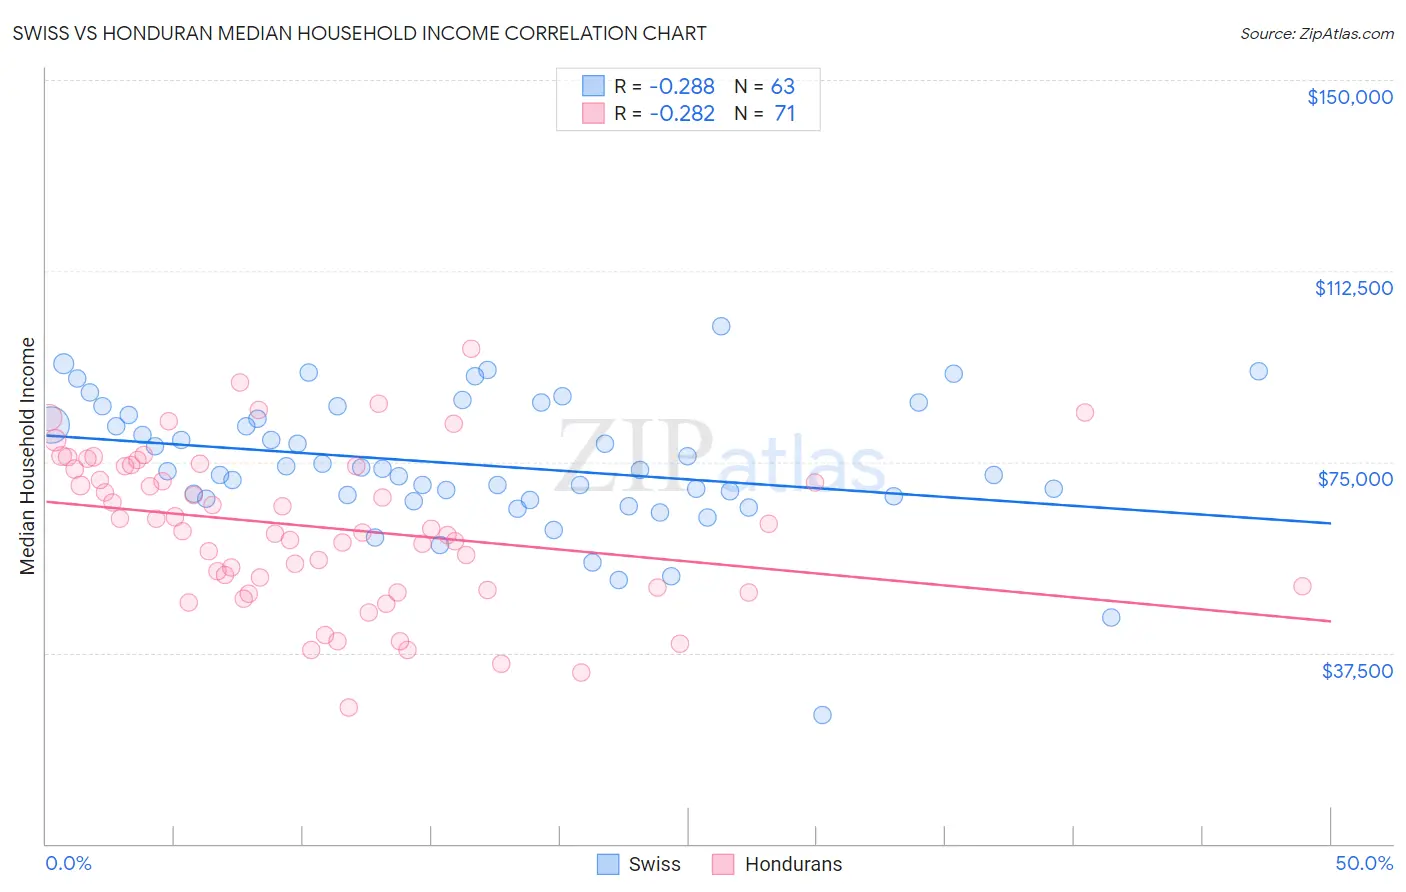
Swiss vs Honduran Median Household Income Correlation Chart
The statistical analysis conducted on geographies consisting of 464,626,684 people shows a weak negative correlation between the proportion of Swiss and median household income in the United States with a correlation coefficient (R) of -0.288 and weighted average of $85,681. Similarly, the statistical analysis conducted on geographies consisting of 357,531,795 people shows a weak negative correlation between the proportion of Hondurans and median household income in the United States with a correlation coefficient (R) of -0.282 and weighted average of $72,588, a difference of 18.0%.
Median Household Income Correlation Summary
| Measurement | Swiss | Honduran |
| Minimum | $25,245 | $26,822 |
| Maximum | $101,562 | $97,304 |
| Range | $76,317 | $70,482 |
| Mean | $74,409 | $62,141 |
| Median | $73,303 | $61,786 |
| Interquartile 25% (IQ1) | $67,788 | $50,302 |
| Interquartile 75% (IQ3) | $84,144 | $74,115 |
| Interquartile Range (IQR) | $16,356 | $23,813 |
| Standard Deviation (Sample) | $13,178 | $15,104 |
| Standard Deviation (Population) | $13,073 | $14,997 |
Similar Demographics by Median Household Income
Demographics Similar to Swiss by Median Household Income
In terms of median household income, the demographic groups most similar to Swiss are Colombian ($85,716, a difference of 0.040%), Immigrants from South America ($85,611, a difference of 0.080%), Icelander ($85,797, a difference of 0.14%), Slovene ($85,562, a difference of 0.14%), and Immigrants ($85,818, a difference of 0.16%).
| Demographics | Rating | Rank | Median Household Income |
| Czechs | 66.4 /100 | #163 | Good $86,164 |
| Irish | 66.2 /100 | #164 | Good $86,145 |
| Norwegians | 65.3 /100 | #165 | Good $86,084 |
| Scandinavians | 65.1 /100 | #166 | Good $86,073 |
| Immigrants | Immigrants | 61.3 /100 | #167 | Good $85,818 |
| Icelanders | 61.0 /100 | #168 | Good $85,797 |
| Colombians | 59.7 /100 | #169 | Average $85,716 |
| Swiss | 59.2 /100 | #170 | Average $85,681 |
| Immigrants | South America | 58.1 /100 | #171 | Average $85,611 |
| Slovenes | 57.4 /100 | #172 | Average $85,562 |
| Immigrants | Cameroon | 53.4 /100 | #173 | Average $85,314 |
| Scottish | 50.0 /100 | #174 | Average $85,101 |
| Immigrants | Costa Rica | 49.2 /100 | #175 | Average $85,054 |
| Alsatians | 49.2 /100 | #176 | Average $85,053 |
| Immigrants | Eritrea | 48.8 /100 | #177 | Average $85,025 |
Demographics Similar to Hondurans by Median Household Income
In terms of median household income, the demographic groups most similar to Hondurans are Immigrants from Haiti ($72,599, a difference of 0.020%), Potawatomi ($72,576, a difference of 0.020%), African ($72,650, a difference of 0.090%), Shoshone ($72,660, a difference of 0.10%), and Cherokee ($72,682, a difference of 0.13%).
| Demographics | Rating | Rank | Median Household Income |
| Paiute | 0.0 /100 | #298 | Tragic $72,959 |
| Indonesians | 0.0 /100 | #299 | Tragic $72,856 |
| Immigrants | Dominica | 0.0 /100 | #300 | Tragic $72,760 |
| Cherokee | 0.0 /100 | #301 | Tragic $72,682 |
| Shoshone | 0.0 /100 | #302 | Tragic $72,660 |
| Africans | 0.0 /100 | #303 | Tragic $72,650 |
| Immigrants | Haiti | 0.0 /100 | #304 | Tragic $72,599 |
| Hondurans | 0.0 /100 | #305 | Tragic $72,588 |
| Potawatomi | 0.0 /100 | #306 | Tragic $72,576 |
| Ute | 0.0 /100 | #307 | Tragic $72,402 |
| Yakama | 0.0 /100 | #308 | Tragic $72,225 |
| Immigrants | Caribbean | 0.0 /100 | #309 | Tragic $71,860 |
| U.S. Virgin Islanders | 0.0 /100 | #310 | Tragic $71,853 |
| Immigrants | Zaire | 0.0 /100 | #311 | Tragic $71,801 |
| Immigrants | Honduras | 0.0 /100 | #312 | Tragic $71,452 |