Immigrants from Moldova vs Albanian Median Male Earnings
COMPARE
Immigrants from Moldova
Albanian
Median Male Earnings
Median Male Earnings Comparison
Immigrants from Moldova
Albanians
$59,417
MEDIAN MALE EARNINGS
99.2/ 100
METRIC RATING
89th/ 347
METRIC RANK
$58,680
MEDIAN MALE EARNINGS
98.4/ 100
METRIC RATING
96th/ 347
METRIC RANK
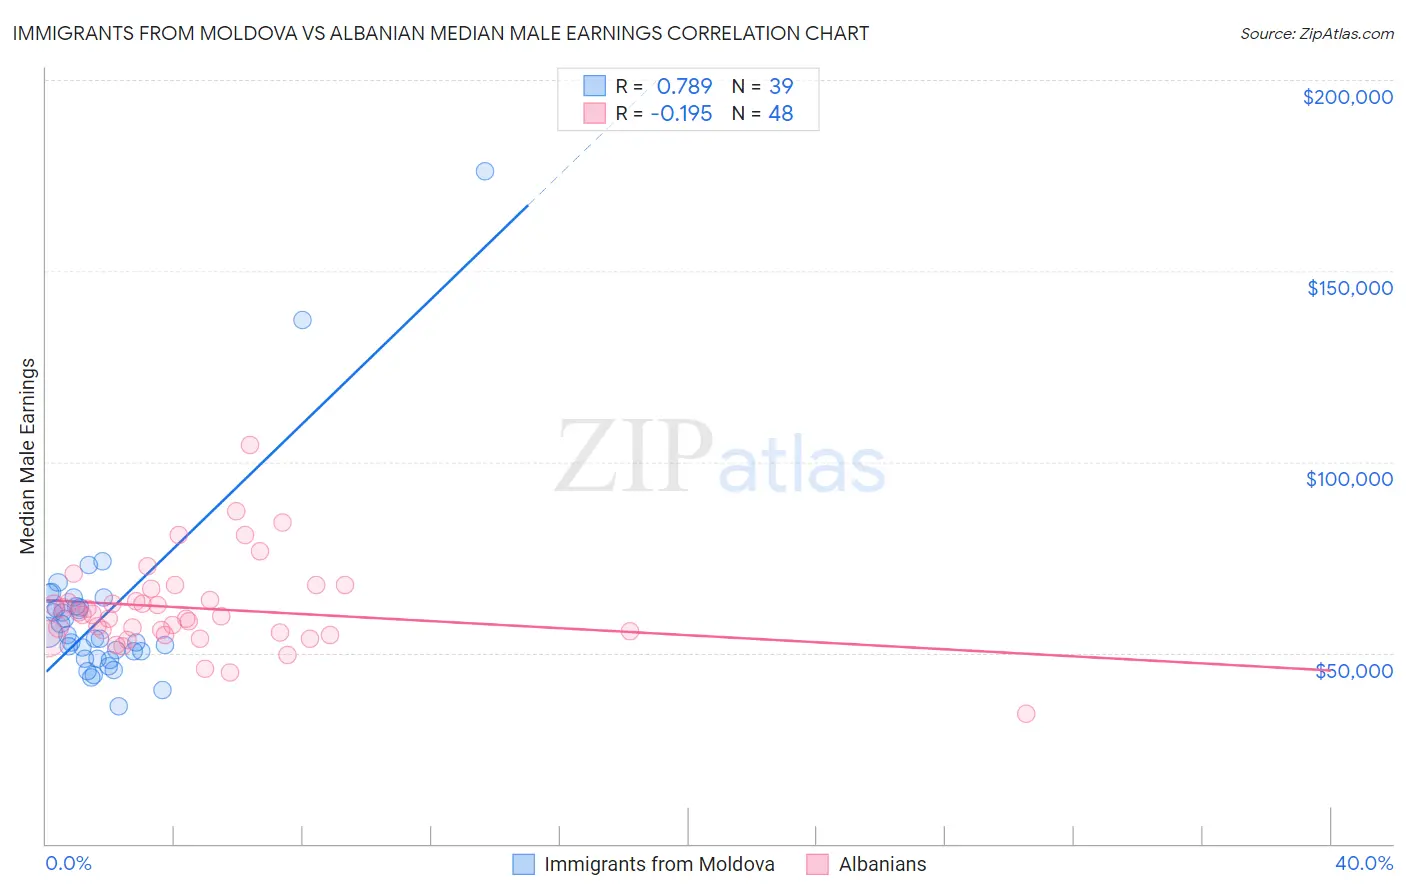
Immigrants from Moldova vs Albanian Median Male Earnings Correlation Chart
The statistical analysis conducted on geographies consisting of 124,394,604 people shows a strong positive correlation between the proportion of Immigrants from Moldova and median male earnings in the United States with a correlation coefficient (R) of 0.789 and weighted average of $59,417. Similarly, the statistical analysis conducted on geographies consisting of 193,234,421 people shows a poor negative correlation between the proportion of Albanians and median male earnings in the United States with a correlation coefficient (R) of -0.195 and weighted average of $58,680, a difference of 1.3%.
Median Male Earnings Correlation Summary
| Measurement | Immigrants from Moldova | Albanian |
| Minimum | $35,909 | $34,079 |
| Maximum | $176,076 | $104,479 |
| Range | $140,167 | $70,400 |
| Mean | $60,240 | $61,666 |
| Median | $53,815 | $59,610 |
| Interquartile 25% (IQ1) | $48,477 | $54,972 |
| Interquartile 75% (IQ3) | $62,160 | $65,262 |
| Interquartile Range (IQR) | $13,683 | $10,290 |
| Standard Deviation (Sample) | $24,701 | $11,807 |
| Standard Deviation (Population) | $24,383 | $11,684 |
Demographics Similar to Immigrants from Moldova and Albanians by Median Male Earnings
In terms of median male earnings, the demographic groups most similar to Immigrants from Moldova are Austrian ($59,359, a difference of 0.10%), Laotian ($59,351, a difference of 0.11%), Immigrants from Argentina ($59,491, a difference of 0.12%), Immigrants from England ($59,527, a difference of 0.18%), and Macedonian ($59,522, a difference of 0.18%). Similarly, the demographic groups most similar to Albanians are Northern European ($58,588, a difference of 0.16%), Immigrants from Lebanon ($58,835, a difference of 0.27%), Jordanian ($58,500, a difference of 0.31%), Immigrants from Poland ($58,452, a difference of 0.39%), and Assyrian/Chaldean/Syriac ($58,437, a difference of 0.42%).
| Demographics | Rating | Rank | Median Male Earnings |
| Croatians | 99.4 /100 | #82 | Exceptional $59,715 |
| Immigrants | Italy | 99.4 /100 | #83 | Exceptional $59,691 |
| Afghans | 99.3 /100 | #84 | Exceptional $59,554 |
| Italians | 99.3 /100 | #85 | Exceptional $59,551 |
| Immigrants | England | 99.3 /100 | #86 | Exceptional $59,527 |
| Macedonians | 99.3 /100 | #87 | Exceptional $59,522 |
| Immigrants | Argentina | 99.3 /100 | #88 | Exceptional $59,491 |
| Immigrants | Moldova | 99.2 /100 | #89 | Exceptional $59,417 |
| Austrians | 99.2 /100 | #90 | Exceptional $59,359 |
| Laotians | 99.2 /100 | #91 | Exceptional $59,351 |
| Immigrants | Kazakhstan | 99.1 /100 | #92 | Exceptional $59,278 |
| Immigrants | Southern Europe | 99.0 /100 | #93 | Exceptional $59,217 |
| Immigrants | North Macedonia | 99.0 /100 | #94 | Exceptional $59,189 |
| Immigrants | Lebanon | 98.6 /100 | #95 | Exceptional $58,835 |
| Albanians | 98.4 /100 | #96 | Exceptional $58,680 |
| Northern Europeans | 98.2 /100 | #97 | Exceptional $58,588 |
| Jordanians | 98.1 /100 | #98 | Exceptional $58,500 |
| Immigrants | Poland | 98.0 /100 | #99 | Exceptional $58,452 |
| Assyrians/Chaldeans/Syriacs | 97.9 /100 | #100 | Exceptional $58,437 |
| Immigrants | Brazil | 97.7 /100 | #101 | Exceptional $58,324 |
| Syrians | 97.4 /100 | #102 | Exceptional $58,187 |