Swedish vs Immigrants from Ethiopia Median Female Earnings
COMPARE
Swedish
Immigrants from Ethiopia
Median Female Earnings
Median Female Earnings Comparison
Swedes
Immigrants from Ethiopia
$39,421
MEDIAN FEMALE EARNINGS
36.0/ 100
METRIC RATING
187th/ 347
METRIC RANK
$42,744
MEDIAN FEMALE EARNINGS
99.8/ 100
METRIC RATING
70th/ 347
METRIC RANK
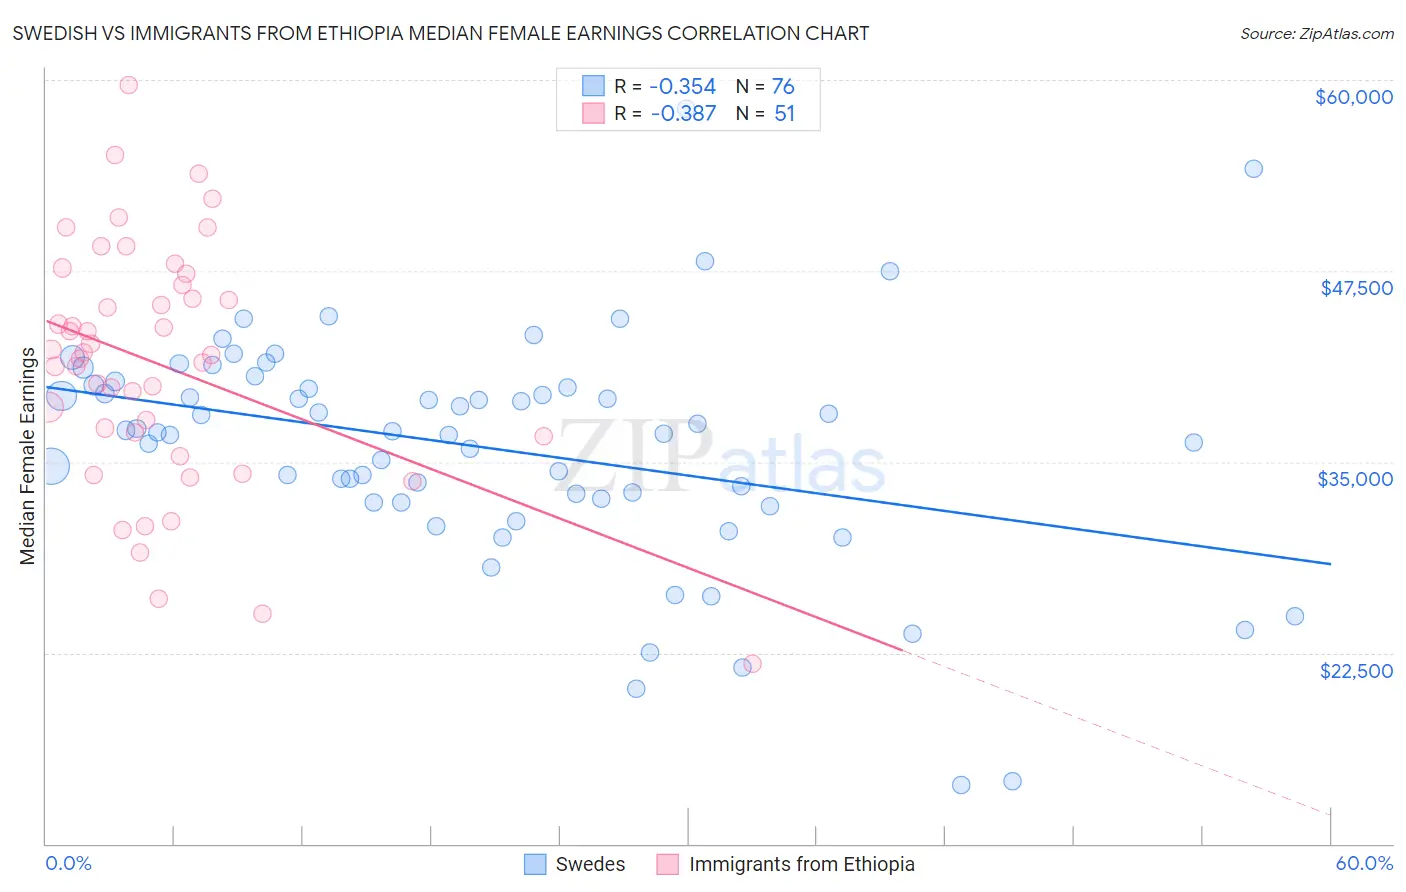
Swedish vs Immigrants from Ethiopia Median Female Earnings Correlation Chart
The statistical analysis conducted on geographies consisting of 538,112,894 people shows a mild negative correlation between the proportion of Swedes and median female earnings in the United States with a correlation coefficient (R) of -0.354 and weighted average of $39,421. Similarly, the statistical analysis conducted on geographies consisting of 211,549,153 people shows a mild negative correlation between the proportion of Immigrants from Ethiopia and median female earnings in the United States with a correlation coefficient (R) of -0.387 and weighted average of $42,744, a difference of 8.4%.
Median Female Earnings Correlation Summary
| Measurement | Swedish | Immigrants from Ethiopia |
| Minimum | $13,839 | $21,797 |
| Maximum | $58,087 | $59,671 |
| Range | $44,248 | $37,874 |
| Mean | $35,925 | $41,343 |
| Median | $36,993 | $41,993 |
| Interquartile 25% (IQ1) | $32,470 | $36,641 |
| Interquartile 75% (IQ3) | $39,982 | $46,569 |
| Interquartile Range (IQR) | $7,512 | $9,928 |
| Standard Deviation (Sample) | $7,648 | $7,910 |
| Standard Deviation (Population) | $7,597 | $7,832 |
Similar Demographics by Median Female Earnings
Demographics Similar to Swedes by Median Female Earnings
In terms of median female earnings, the demographic groups most similar to Swedes are Bermudan ($39,418, a difference of 0.010%), Immigrants from West Indies ($39,441, a difference of 0.050%), Colombian ($39,439, a difference of 0.050%), European ($39,457, a difference of 0.090%), and Senegalese ($39,384, a difference of 0.090%).
| Demographics | Rating | Rank | Median Female Earnings |
| Immigrants | Kenya | 41.6 /100 | #180 | Average $39,535 |
| Tsimshian | 41.4 /100 | #181 | Average $39,530 |
| Tlingit-Haida | 40.5 /100 | #182 | Average $39,513 |
| Hungarians | 40.3 /100 | #183 | Average $39,510 |
| Europeans | 37.7 /100 | #184 | Fair $39,457 |
| Immigrants | West Indies | 36.9 /100 | #185 | Fair $39,441 |
| Colombians | 36.9 /100 | #186 | Fair $39,439 |
| Swedes | 36.0 /100 | #187 | Fair $39,421 |
| Bermudans | 35.9 /100 | #188 | Fair $39,418 |
| Senegalese | 34.2 /100 | #189 | Fair $39,384 |
| Puget Sound Salish | 33.9 /100 | #190 | Fair $39,376 |
| Immigrants | Western Africa | 32.7 /100 | #191 | Fair $39,351 |
| Immigrants | Immigrants | 31.7 /100 | #192 | Fair $39,328 |
| Immigrants | Nigeria | 30.2 /100 | #193 | Fair $39,294 |
| Irish | 30.0 /100 | #194 | Fair $39,291 |
Demographics Similar to Immigrants from Ethiopia by Median Female Earnings
In terms of median female earnings, the demographic groups most similar to Immigrants from Ethiopia are Immigrants from Romania ($42,718, a difference of 0.060%), Immigrants from Spain ($42,815, a difference of 0.17%), Immigrants from Austria ($42,824, a difference of 0.19%), Immigrants from Norway ($42,837, a difference of 0.22%), and Immigrants from Egypt ($42,837, a difference of 0.22%).
| Demographics | Rating | Rank | Median Female Earnings |
| Immigrants | Ukraine | 99.9 /100 | #63 | Exceptional $43,069 |
| Immigrants | Pakistan | 99.9 /100 | #64 | Exceptional $43,052 |
| Sierra Leoneans | 99.9 /100 | #65 | Exceptional $42,868 |
| Immigrants | Norway | 99.9 /100 | #66 | Exceptional $42,837 |
| Immigrants | Egypt | 99.9 /100 | #67 | Exceptional $42,837 |
| Immigrants | Austria | 99.8 /100 | #68 | Exceptional $42,824 |
| Immigrants | Spain | 99.8 /100 | #69 | Exceptional $42,815 |
| Immigrants | Ethiopia | 99.8 /100 | #70 | Exceptional $42,744 |
| Immigrants | Romania | 99.8 /100 | #71 | Exceptional $42,718 |
| Albanians | 99.8 /100 | #72 | Exceptional $42,584 |
| Mongolians | 99.7 /100 | #73 | Exceptional $42,542 |
| Immigrants | South Africa | 99.7 /100 | #74 | Exceptional $42,508 |
| New Zealanders | 99.7 /100 | #75 | Exceptional $42,446 |
| Immigrants | Italy | 99.7 /100 | #76 | Exceptional $42,446 |
| Immigrants | Albania | 99.6 /100 | #77 | Exceptional $42,388 |