Soviet Union vs Immigrants from Norway Householder Income Ages 25 - 44 years
COMPARE
Soviet Union
Immigrants from Norway
Householder Income Ages 25 - 44 years
Householder Income Ages 25 - 44 years Comparison
Soviet Union
Immigrants from Norway
$108,457
HOUSEHOLDER INCOME AGES 25 - 44 YEARS
100.0/ 100
METRIC RATING
38th/ 347
METRIC RANK
$106,629
HOUSEHOLDER INCOME AGES 25 - 44 YEARS
99.9/ 100
METRIC RATING
53rd/ 347
METRIC RANK
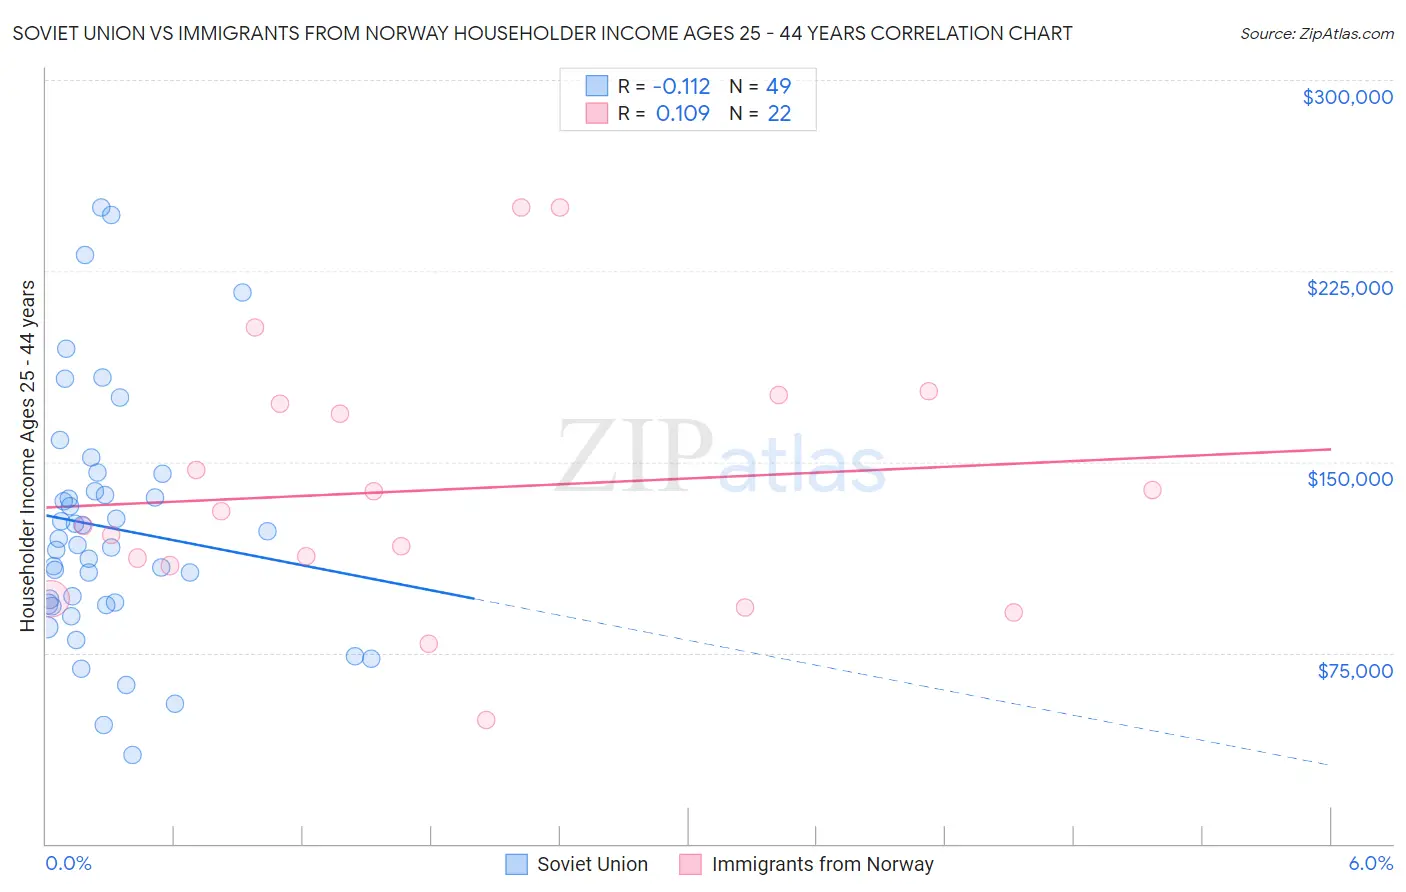
Soviet Union vs Immigrants from Norway Householder Income Ages 25 - 44 years Correlation Chart
The statistical analysis conducted on geographies consisting of 43,505,949 people shows a poor negative correlation between the proportion of Soviet Union and household income with householder between the ages 25 and 44 in the United States with a correlation coefficient (R) of -0.112 and weighted average of $108,457. Similarly, the statistical analysis conducted on geographies consisting of 116,548,648 people shows a poor positive correlation between the proportion of Immigrants from Norway and household income with householder between the ages 25 and 44 in the United States with a correlation coefficient (R) of 0.109 and weighted average of $106,629, a difference of 1.7%.
Householder Income Ages 25 - 44 years Correlation Summary
| Measurement | Soviet Union | Immigrants from Norway |
| Minimum | $34,886 | $48,750 |
| Maximum | $250,001 | $250,001 |
| Range | $215,115 | $201,251 |
| Mean | $124,105 | $138,956 |
| Median | $117,252 | $127,644 |
| Interquartile 25% (IQ1) | $94,073 | $109,255 |
| Interquartile 75% (IQ3) | $141,816 | $172,615 |
| Interquartile Range (IQR) | $47,743 | $63,360 |
| Standard Deviation (Sample) | $48,204 | $51,236 |
| Standard Deviation (Population) | $47,710 | $50,058 |
Demographics Similar to Soviet Union and Immigrants from Norway by Householder Income Ages 25 - 44 years
In terms of householder income ages 25 - 44 years, the demographic groups most similar to Soviet Union are Immigrants from France ($108,257, a difference of 0.18%), Immigrants from Russia ($108,751, a difference of 0.27%), Immigrants from Lithuania ($108,149, a difference of 0.29%), Immigrants from Bolivia ($108,128, a difference of 0.30%), and Latvian ($108,926, a difference of 0.43%). Similarly, the demographic groups most similar to Immigrants from Norway are Paraguayan ($106,615, a difference of 0.010%), Greek ($106,457, a difference of 0.16%), Immigrants from Europe ($106,817, a difference of 0.18%), Immigrants from Czechoslovakia ($106,888, a difference of 0.24%), and Cambodian ($107,148, a difference of 0.49%).
| Demographics | Rating | Rank | Householder Income Ages 25 - 44 years |
| Immigrants | Switzerland | 100.0 /100 | #35 | Exceptional $109,185 |
| Latvians | 100.0 /100 | #36 | Exceptional $108,926 |
| Immigrants | Russia | 100.0 /100 | #37 | Exceptional $108,751 |
| Soviet Union | 100.0 /100 | #38 | Exceptional $108,457 |
| Immigrants | France | 99.9 /100 | #39 | Exceptional $108,257 |
| Immigrants | Lithuania | 99.9 /100 | #40 | Exceptional $108,149 |
| Immigrants | Bolivia | 99.9 /100 | #41 | Exceptional $108,128 |
| Australians | 99.9 /100 | #42 | Exceptional $107,912 |
| Immigrants | Malaysia | 99.9 /100 | #43 | Exceptional $107,650 |
| Immigrants | Indonesia | 99.9 /100 | #44 | Exceptional $107,627 |
| Israelis | 99.9 /100 | #45 | Exceptional $107,579 |
| Immigrants | Belarus | 99.9 /100 | #46 | Exceptional $107,393 |
| Estonians | 99.9 /100 | #47 | Exceptional $107,269 |
| Bulgarians | 99.9 /100 | #48 | Exceptional $107,264 |
| Immigrants | Turkey | 99.9 /100 | #49 | Exceptional $107,258 |
| Cambodians | 99.9 /100 | #50 | Exceptional $107,148 |
| Immigrants | Czechoslovakia | 99.9 /100 | #51 | Exceptional $106,888 |
| Immigrants | Europe | 99.9 /100 | #52 | Exceptional $106,817 |
| Immigrants | Norway | 99.9 /100 | #53 | Exceptional $106,629 |
| Paraguayans | 99.9 /100 | #54 | Exceptional $106,615 |
| Greeks | 99.9 /100 | #55 | Exceptional $106,457 |