Soviet Union vs Syrian Householder Income Ages 25 - 44 years
COMPARE
Soviet Union
Syrian
Householder Income Ages 25 - 44 years
Householder Income Ages 25 - 44 years Comparison
Soviet Union
Syrians
$108,457
HOUSEHOLDER INCOME AGES 25 - 44 YEARS
100.0/ 100
METRIC RATING
38th/ 347
METRIC RANK
$99,215
HOUSEHOLDER INCOME AGES 25 - 44 YEARS
92.9/ 100
METRIC RATING
118th/ 347
METRIC RANK
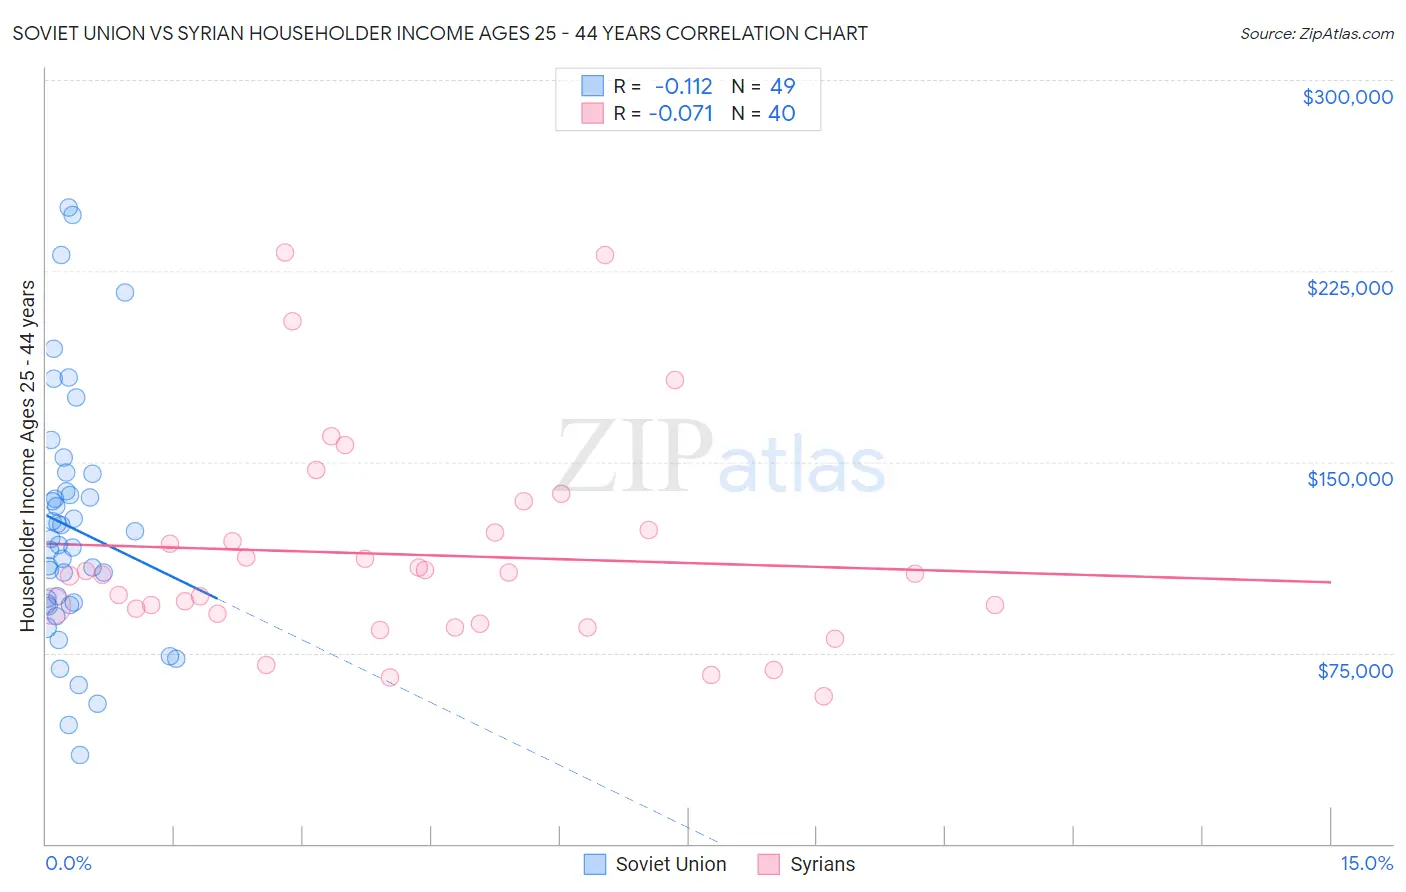
Soviet Union vs Syrian Householder Income Ages 25 - 44 years Correlation Chart
The statistical analysis conducted on geographies consisting of 43,505,949 people shows a poor negative correlation between the proportion of Soviet Union and household income with householder between the ages 25 and 44 in the United States with a correlation coefficient (R) of -0.112 and weighted average of $108,457. Similarly, the statistical analysis conducted on geographies consisting of 265,710,872 people shows a slight negative correlation between the proportion of Syrians and household income with householder between the ages 25 and 44 in the United States with a correlation coefficient (R) of -0.071 and weighted average of $99,215, a difference of 9.3%.
Householder Income Ages 25 - 44 years Correlation Summary
| Measurement | Soviet Union | Syrian |
| Minimum | $34,886 | $57,774 |
| Maximum | $250,001 | $232,386 |
| Range | $215,115 | $174,612 |
| Mean | $124,105 | $113,575 |
| Median | $117,252 | $105,902 |
| Interquartile 25% (IQ1) | $94,073 | $88,495 |
| Interquartile 75% (IQ3) | $141,816 | $122,954 |
| Interquartile Range (IQR) | $47,743 | $34,460 |
| Standard Deviation (Sample) | $48,204 | $41,385 |
| Standard Deviation (Population) | $47,710 | $40,865 |
Similar Demographics by Householder Income Ages 25 - 44 years
Demographics Similar to Soviet Union by Householder Income Ages 25 - 44 years
In terms of householder income ages 25 - 44 years, the demographic groups most similar to Soviet Union are Immigrants from France ($108,257, a difference of 0.18%), Immigrants from Russia ($108,751, a difference of 0.27%), Immigrants from Lithuania ($108,149, a difference of 0.29%), Immigrants from Bolivia ($108,128, a difference of 0.30%), and Latvian ($108,926, a difference of 0.43%).
| Demographics | Rating | Rank | Householder Income Ages 25 - 44 years |
| Maltese | 100.0 /100 | #31 | Exceptional $110,064 |
| Immigrants | Sri Lanka | 100.0 /100 | #32 | Exceptional $109,741 |
| Bhutanese | 100.0 /100 | #33 | Exceptional $109,520 |
| Bolivians | 100.0 /100 | #34 | Exceptional $109,372 |
| Immigrants | Switzerland | 100.0 /100 | #35 | Exceptional $109,185 |
| Latvians | 100.0 /100 | #36 | Exceptional $108,926 |
| Immigrants | Russia | 100.0 /100 | #37 | Exceptional $108,751 |
| Soviet Union | 100.0 /100 | #38 | Exceptional $108,457 |
| Immigrants | France | 99.9 /100 | #39 | Exceptional $108,257 |
| Immigrants | Lithuania | 99.9 /100 | #40 | Exceptional $108,149 |
| Immigrants | Bolivia | 99.9 /100 | #41 | Exceptional $108,128 |
| Australians | 99.9 /100 | #42 | Exceptional $107,912 |
| Immigrants | Malaysia | 99.9 /100 | #43 | Exceptional $107,650 |
| Immigrants | Indonesia | 99.9 /100 | #44 | Exceptional $107,627 |
| Israelis | 99.9 /100 | #45 | Exceptional $107,579 |
Demographics Similar to Syrians by Householder Income Ages 25 - 44 years
In terms of householder income ages 25 - 44 years, the demographic groups most similar to Syrians are Immigrants from Northern Africa ($99,232, a difference of 0.020%), Jordanian ($99,186, a difference of 0.030%), Swedish ($99,136, a difference of 0.080%), Portuguese ($99,429, a difference of 0.22%), and Carpatho Rusyn ($99,449, a difference of 0.24%).
| Demographics | Rating | Rank | Householder Income Ages 25 - 44 years |
| Chileans | 95.1 /100 | #111 | Exceptional $99,900 |
| Poles | 94.5 /100 | #112 | Exceptional $99,685 |
| Tongans | 94.2 /100 | #113 | Exceptional $99,604 |
| Immigrants | Western Asia | 94.0 /100 | #114 | Exceptional $99,516 |
| Carpatho Rusyns | 93.7 /100 | #115 | Exceptional $99,449 |
| Portuguese | 93.7 /100 | #116 | Exceptional $99,429 |
| Immigrants | Northern Africa | 93.0 /100 | #117 | Exceptional $99,232 |
| Syrians | 92.9 /100 | #118 | Exceptional $99,215 |
| Jordanians | 92.8 /100 | #119 | Exceptional $99,186 |
| Swedes | 92.7 /100 | #120 | Exceptional $99,136 |
| Peruvians | 91.7 /100 | #121 | Exceptional $98,886 |
| Immigrants | Uzbekistan | 91.5 /100 | #122 | Exceptional $98,849 |
| Palestinians | 91.2 /100 | #123 | Exceptional $98,777 |
| Zimbabweans | 90.3 /100 | #124 | Exceptional $98,586 |
| Pakistanis | 89.3 /100 | #125 | Excellent $98,401 |