Afghan vs Immigrants from Norway Householder Income Ages 25 - 44 years
COMPARE
Afghan
Immigrants from Norway
Householder Income Ages 25 - 44 years
Householder Income Ages 25 - 44 years Comparison
Afghans
Immigrants from Norway
$104,410
HOUSEHOLDER INCOME AGES 25 - 44 YEARS
99.6/ 100
METRIC RATING
71st/ 347
METRIC RANK
$106,629
HOUSEHOLDER INCOME AGES 25 - 44 YEARS
99.9/ 100
METRIC RATING
53rd/ 347
METRIC RANK
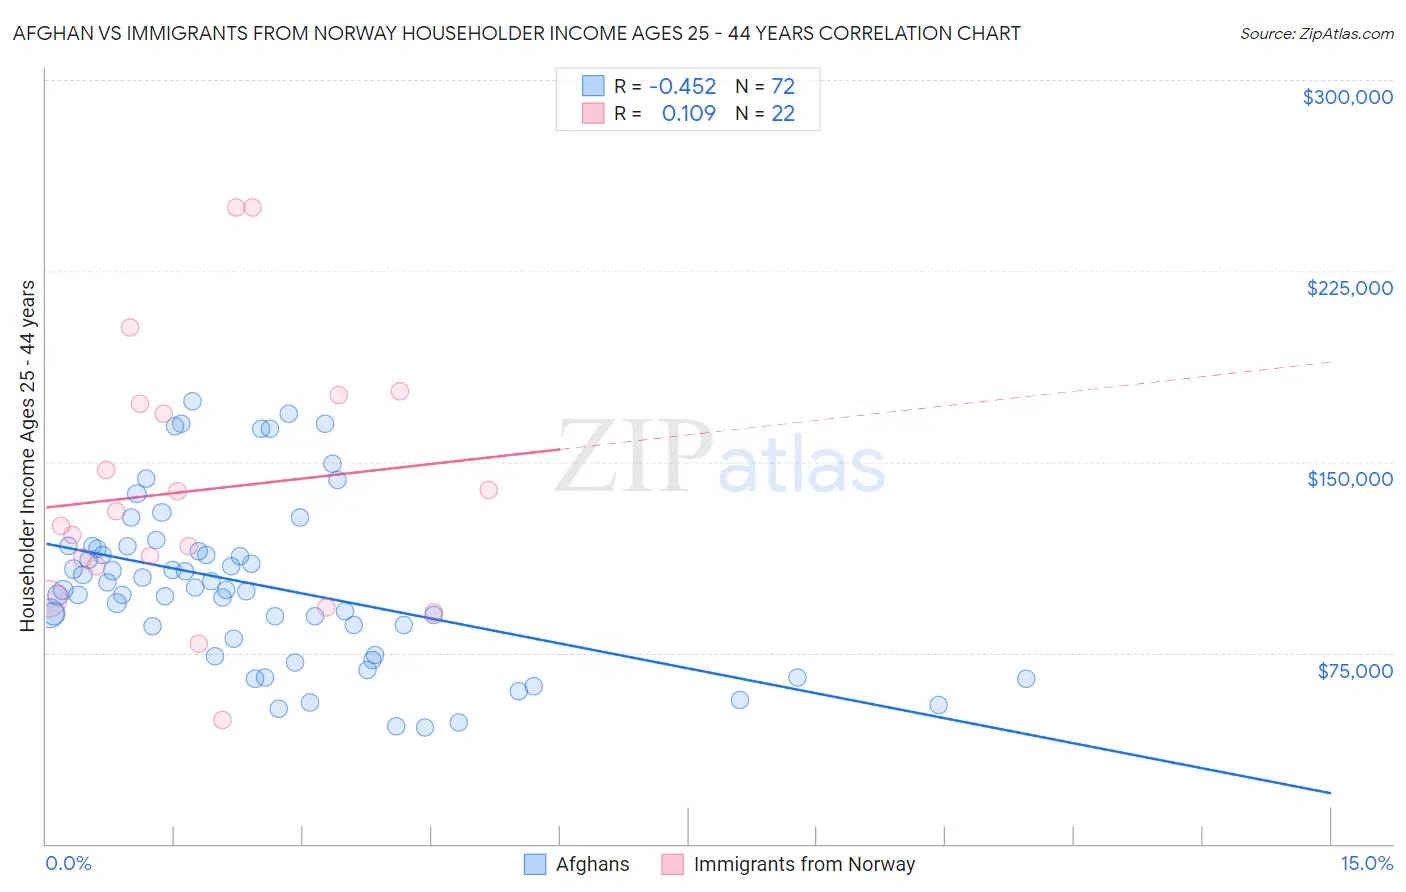
Afghan vs Immigrants from Norway Householder Income Ages 25 - 44 years Correlation Chart
The statistical analysis conducted on geographies consisting of 148,765,524 people shows a moderate negative correlation between the proportion of Afghans and household income with householder between the ages 25 and 44 in the United States with a correlation coefficient (R) of -0.452 and weighted average of $104,410. Similarly, the statistical analysis conducted on geographies consisting of 116,548,648 people shows a poor positive correlation between the proportion of Immigrants from Norway and household income with householder between the ages 25 and 44 in the United States with a correlation coefficient (R) of 0.109 and weighted average of $106,629, a difference of 2.1%.
Householder Income Ages 25 - 44 years Correlation Summary
| Measurement | Afghan | Immigrants from Norway |
| Minimum | $45,809 | $48,750 |
| Maximum | $173,653 | $250,001 |
| Range | $127,844 | $201,251 |
| Mean | $101,372 | $138,956 |
| Median | $99,588 | $127,644 |
| Interquartile 25% (IQ1) | $77,205 | $109,255 |
| Interquartile 75% (IQ3) | $116,400 | $172,615 |
| Interquartile Range (IQR) | $39,195 | $63,360 |
| Standard Deviation (Sample) | $32,218 | $51,236 |
| Standard Deviation (Population) | $31,993 | $50,058 |
Demographics Similar to Afghans and Immigrants from Norway by Householder Income Ages 25 - 44 years
In terms of householder income ages 25 - 44 years, the demographic groups most similar to Afghans are Immigrants from Croatia ($104,503, a difference of 0.090%), Chinese ($104,264, a difference of 0.14%), Mongolian ($104,578, a difference of 0.16%), Immigrants from Eastern Europe ($104,662, a difference of 0.24%), and Immigrants from Romania ($104,713, a difference of 0.29%). Similarly, the demographic groups most similar to Immigrants from Norway are Paraguayan ($106,615, a difference of 0.010%), Greek ($106,457, a difference of 0.16%), Immigrants from Europe ($106,817, a difference of 0.18%), Immigrants from Pakistan ($106,129, a difference of 0.47%), and Immigrants from Austria ($106,103, a difference of 0.50%).
| Demographics | Rating | Rank | Householder Income Ages 25 - 44 years |
| Immigrants | Europe | 99.9 /100 | #52 | Exceptional $106,817 |
| Immigrants | Norway | 99.9 /100 | #53 | Exceptional $106,629 |
| Paraguayans | 99.9 /100 | #54 | Exceptional $106,615 |
| Greeks | 99.9 /100 | #55 | Exceptional $106,457 |
| Immigrants | Pakistan | 99.8 /100 | #56 | Exceptional $106,129 |
| Immigrants | Austria | 99.8 /100 | #57 | Exceptional $106,103 |
| Immigrants | South Africa | 99.8 /100 | #58 | Exceptional $105,748 |
| Immigrants | Latvia | 99.8 /100 | #59 | Exceptional $105,522 |
| Egyptians | 99.7 /100 | #60 | Exceptional $105,282 |
| Lithuanians | 99.7 /100 | #61 | Exceptional $105,223 |
| Immigrants | Italy | 99.7 /100 | #62 | Exceptional $105,201 |
| Immigrants | Scotland | 99.7 /100 | #63 | Exceptional $105,089 |
| New Zealanders | 99.7 /100 | #64 | Exceptional $105,085 |
| Immigrants | Netherlands | 99.7 /100 | #65 | Exceptional $105,082 |
| Laotians | 99.7 /100 | #66 | Exceptional $104,993 |
| Immigrants | Romania | 99.6 /100 | #67 | Exceptional $104,713 |
| Immigrants | Eastern Europe | 99.6 /100 | #68 | Exceptional $104,662 |
| Mongolians | 99.6 /100 | #69 | Exceptional $104,578 |
| Immigrants | Croatia | 99.6 /100 | #70 | Exceptional $104,503 |
| Afghans | 99.6 /100 | #71 | Exceptional $104,410 |
| Chinese | 99.5 /100 | #72 | Exceptional $104,264 |