Sioux vs Immigrants from Cambodia Wage/Income Gap
COMPARE
Sioux
Immigrants from Cambodia
Wage/Income Gap
Wage/Income Gap Comparison
Sioux
Immigrants from Cambodia
24.3%
WAGE/INCOME GAP
96.9/ 100
METRIC RATING
113th/ 347
METRIC RANK
23.3%
WAGE/INCOME GAP
99.7/ 100
METRIC RATING
85th/ 347
METRIC RANK
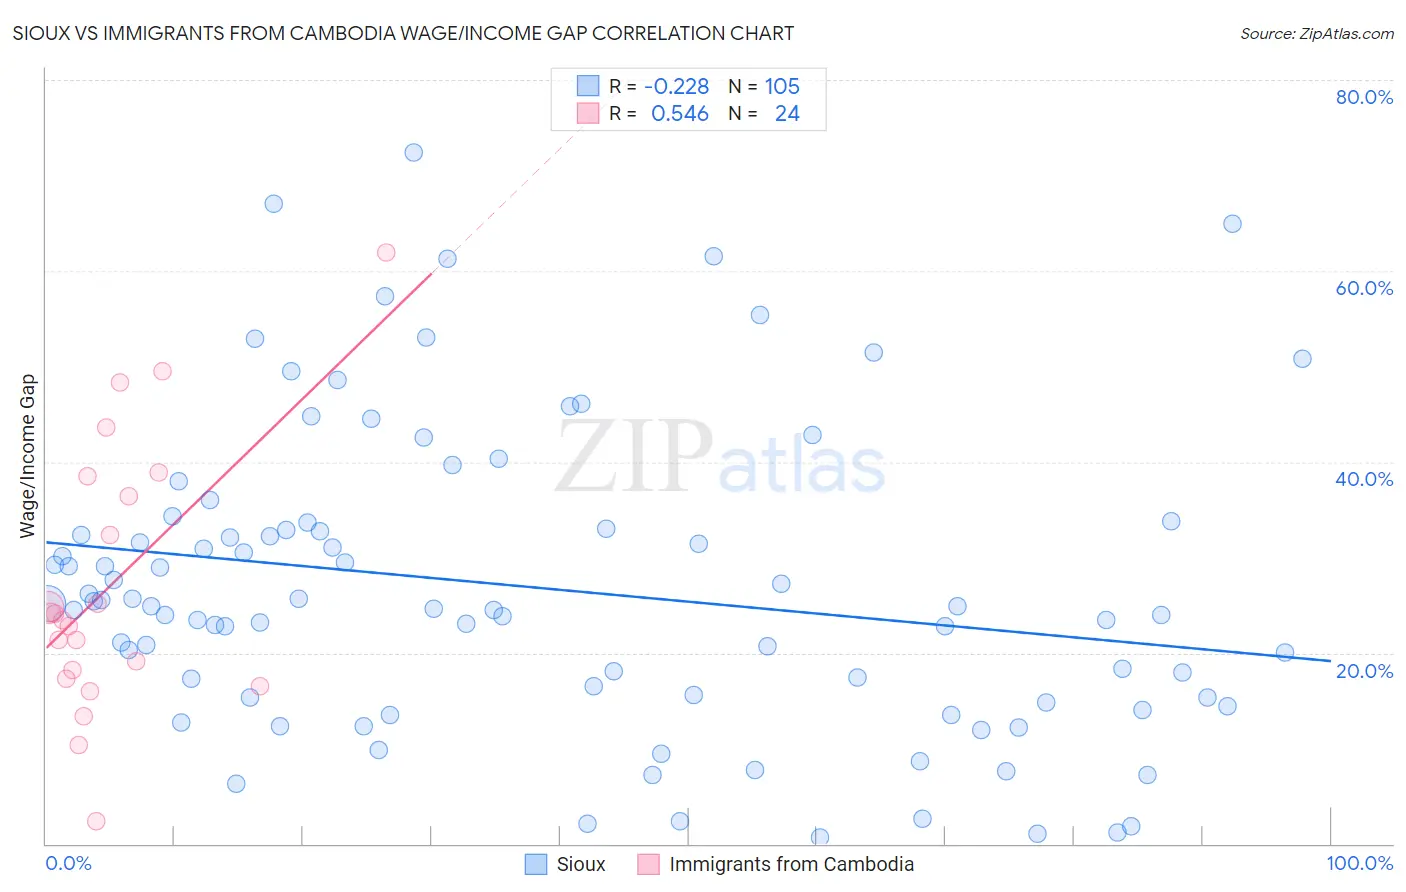
Sioux vs Immigrants from Cambodia Wage/Income Gap Correlation Chart
The statistical analysis conducted on geographies consisting of 233,992,822 people shows a weak negative correlation between the proportion of Sioux and wage/income gap percentage in the United States with a correlation coefficient (R) of -0.228 and weighted average of 24.3%. Similarly, the statistical analysis conducted on geographies consisting of 205,133,865 people shows a substantial positive correlation between the proportion of Immigrants from Cambodia and wage/income gap percentage in the United States with a correlation coefficient (R) of 0.546 and weighted average of 23.3%, a difference of 4.5%.
Wage/Income Gap Correlation Summary
| Measurement | Sioux | Immigrants from Cambodia |
| Minimum | 0.72% | 2.3% |
| Maximum | 72.4% | 61.9% |
| Range | 71.7% | 59.6% |
| Mean | 26.9% | 27.1% |
| Median | 24.9% | 23.8% |
| Interquartile 25% (IQ1) | 15.3% | 17.8% |
| Interquartile 75% (IQ3) | 33.4% | 37.4% |
| Interquartile Range (IQR) | 18.1% | 19.7% |
| Standard Deviation (Sample) | 15.9% | 14.0% |
| Standard Deviation (Population) | 15.8% | 13.7% |
Similar Demographics by Wage/Income Gap
Demographics Similar to Sioux by Wage/Income Gap
In terms of wage/income gap, the demographic groups most similar to Sioux are Immigrants from Colombia (24.3%, a difference of 0.050%), Panamanian (24.4%, a difference of 0.20%), Immigrants from Kenya (24.4%, a difference of 0.26%), Alaska Native (24.4%, a difference of 0.43%), and Soviet Union (24.2%, a difference of 0.45%).
| Demographics | Rating | Rank | Wage/Income Gap |
| Sudanese | 98.6 /100 | #106 | Exceptional 24.0% |
| Yaqui | 98.4 /100 | #107 | Exceptional 24.0% |
| Immigrants | Albania | 98.4 /100 | #108 | Exceptional 24.0% |
| Ugandans | 98.3 /100 | #109 | Exceptional 24.1% |
| Immigrants | Morocco | 98.1 /100 | #110 | Exceptional 24.1% |
| Soviet Union | 97.6 /100 | #111 | Exceptional 24.2% |
| Immigrants | Colombia | 97.0 /100 | #112 | Exceptional 24.3% |
| Sioux | 96.9 /100 | #113 | Exceptional 24.3% |
| Panamanians | 96.5 /100 | #114 | Exceptional 24.4% |
| Immigrants | Kenya | 96.4 /100 | #115 | Exceptional 24.4% |
| Alaska Natives | 96.0 /100 | #116 | Exceptional 24.4% |
| Immigrants | Afghanistan | 95.9 /100 | #117 | Exceptional 24.4% |
| Immigrants | Micronesia | 95.8 /100 | #118 | Exceptional 24.4% |
| Kenyans | 95.8 /100 | #119 | Exceptional 24.5% |
| Cree | 95.6 /100 | #120 | Exceptional 24.5% |
Demographics Similar to Immigrants from Cambodia by Wage/Income Gap
In terms of wage/income gap, the demographic groups most similar to Immigrants from Cambodia are Cuban (23.3%, a difference of 0.050%), Cheyenne (23.3%, a difference of 0.20%), Yuman (23.3%, a difference of 0.25%), Immigrants from Africa (23.2%, a difference of 0.43%), and Immigrants from Panama (23.4%, a difference of 0.57%).
| Demographics | Rating | Rank | Wage/Income Gap |
| Nigerians | 99.9 /100 | #78 | Exceptional 23.0% |
| Immigrants | Nicaragua | 99.9 /100 | #79 | Exceptional 23.0% |
| Salvadorans | 99.9 /100 | #80 | Exceptional 23.0% |
| Bermudans | 99.8 /100 | #81 | Exceptional 23.1% |
| Central Americans | 99.8 /100 | #82 | Exceptional 23.1% |
| Immigrants | Africa | 99.8 /100 | #83 | Exceptional 23.2% |
| Cubans | 99.7 /100 | #84 | Exceptional 23.3% |
| Immigrants | Cambodia | 99.7 /100 | #85 | Exceptional 23.3% |
| Cheyenne | 99.7 /100 | #86 | Exceptional 23.3% |
| Yuman | 99.7 /100 | #87 | Exceptional 23.3% |
| Immigrants | Panama | 99.6 /100 | #88 | Exceptional 23.4% |
| Marshallese | 99.6 /100 | #89 | Exceptional 23.4% |
| Nicaraguans | 99.6 /100 | #90 | Exceptional 23.4% |
| Arapaho | 99.6 /100 | #91 | Exceptional 23.5% |
| Immigrants | Honduras | 99.5 /100 | #92 | Exceptional 23.5% |