Sioux vs Cape Verdean Wage/Income Gap
COMPARE
Sioux
Cape Verdean
Wage/Income Gap
Wage/Income Gap Comparison
Sioux
Cape Verdeans
24.3%
WAGE/INCOME GAP
96.9/ 100
METRIC RATING
113th/ 347
METRIC RANK
23.6%
WAGE/INCOME GAP
99.4/ 100
METRIC RATING
95th/ 347
METRIC RANK
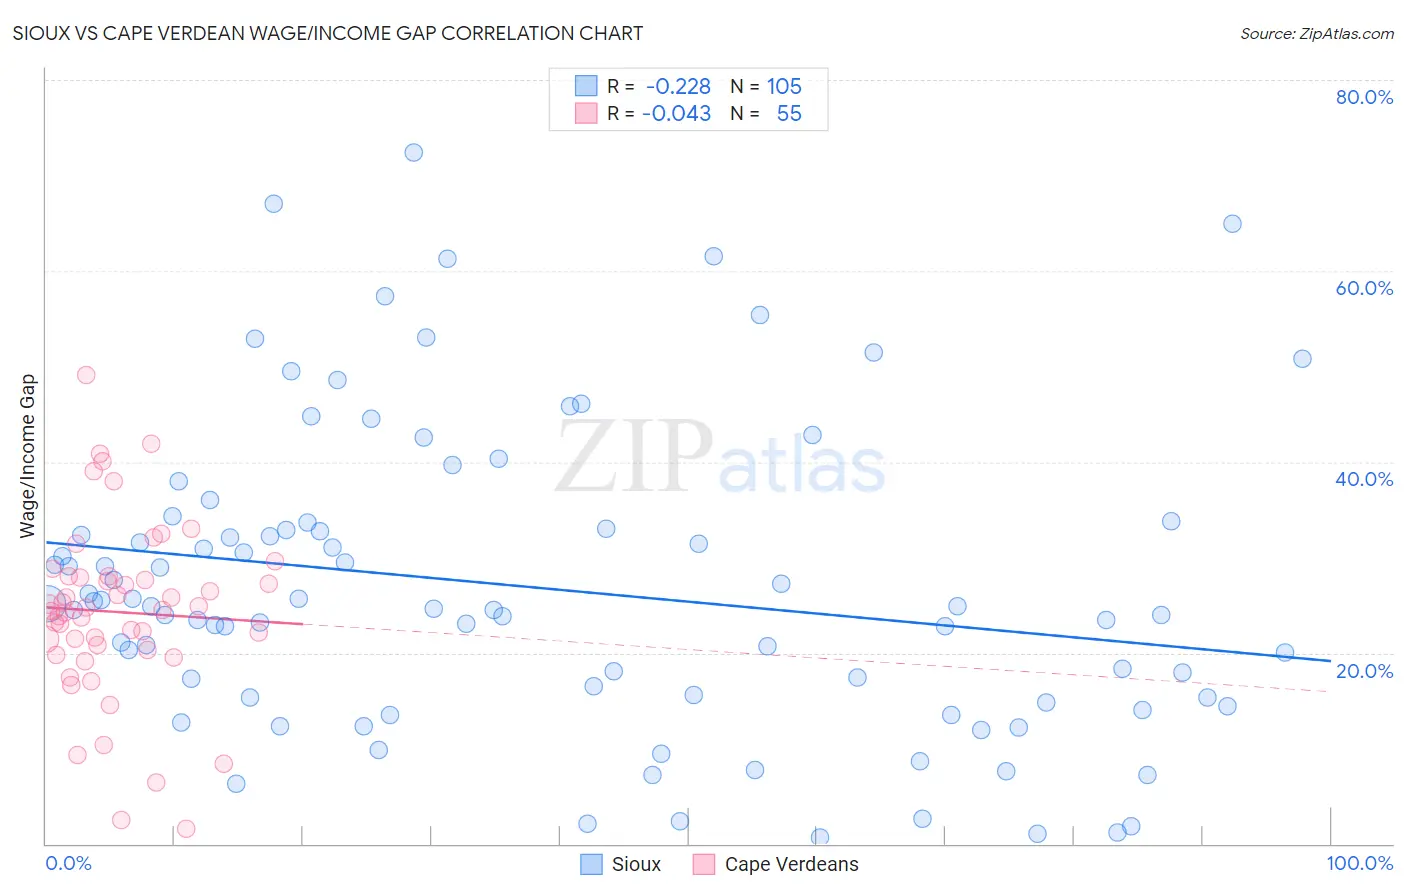
Sioux vs Cape Verdean Wage/Income Gap Correlation Chart
The statistical analysis conducted on geographies consisting of 233,992,822 people shows a weak negative correlation between the proportion of Sioux and wage/income gap percentage in the United States with a correlation coefficient (R) of -0.228 and weighted average of 24.3%. Similarly, the statistical analysis conducted on geographies consisting of 107,547,548 people shows no correlation between the proportion of Cape Verdeans and wage/income gap percentage in the United States with a correlation coefficient (R) of -0.043 and weighted average of 23.6%, a difference of 3.1%.
Wage/Income Gap Correlation Summary
| Measurement | Sioux | Cape Verdean |
| Minimum | 0.72% | 1.5% |
| Maximum | 72.4% | 49.0% |
| Range | 71.7% | 47.5% |
| Mean | 26.9% | 24.3% |
| Median | 24.9% | 24.5% |
| Interquartile 25% (IQ1) | 15.3% | 20.3% |
| Interquartile 75% (IQ3) | 33.4% | 28.0% |
| Interquartile Range (IQR) | 18.1% | 7.6% |
| Standard Deviation (Sample) | 15.9% | 9.2% |
| Standard Deviation (Population) | 15.8% | 9.2% |
Demographics Similar to Sioux and Cape Verdeans by Wage/Income Gap
In terms of wage/income gap, the demographic groups most similar to Sioux are Immigrants from Colombia (24.3%, a difference of 0.050%), Panamanian (24.4%, a difference of 0.20%), Soviet Union (24.2%, a difference of 0.45%), Immigrants from Morocco (24.1%, a difference of 0.89%), and Ugandan (24.1%, a difference of 1.1%). Similarly, the demographic groups most similar to Cape Verdeans are Honduran (23.6%, a difference of 0.030%), Kiowa (23.6%, a difference of 0.12%), Immigrants from Sudan (23.6%, a difference of 0.21%), Immigrants from Latin America (23.7%, a difference of 0.61%), and Aleut (23.7%, a difference of 0.68%).
| Demographics | Rating | Rank | Wage/Income Gap |
| Hondurans | 99.5 /100 | #94 | Exceptional 23.6% |
| Cape Verdeans | 99.4 /100 | #95 | Exceptional 23.6% |
| Kiowa | 99.4 /100 | #96 | Exceptional 23.6% |
| Immigrants | Sudan | 99.4 /100 | #97 | Exceptional 23.6% |
| Immigrants | Latin America | 99.2 /100 | #98 | Exceptional 23.7% |
| Aleuts | 99.2 /100 | #99 | Exceptional 23.7% |
| Yakama | 99.2 /100 | #100 | Exceptional 23.7% |
| Japanese | 99.1 /100 | #101 | Exceptional 23.8% |
| Immigrants | Laos | 99.0 /100 | #102 | Exceptional 23.8% |
| Tsimshian | 98.9 /100 | #103 | Exceptional 23.9% |
| Tlingit-Haida | 98.7 /100 | #104 | Exceptional 24.0% |
| Moroccans | 98.6 /100 | #105 | Exceptional 24.0% |
| Sudanese | 98.6 /100 | #106 | Exceptional 24.0% |
| Yaqui | 98.4 /100 | #107 | Exceptional 24.0% |
| Immigrants | Albania | 98.4 /100 | #108 | Exceptional 24.0% |
| Ugandans | 98.3 /100 | #109 | Exceptional 24.1% |
| Immigrants | Morocco | 98.1 /100 | #110 | Exceptional 24.1% |
| Soviet Union | 97.6 /100 | #111 | Exceptional 24.2% |
| Immigrants | Colombia | 97.0 /100 | #112 | Exceptional 24.3% |
| Sioux | 96.9 /100 | #113 | Exceptional 24.3% |
| Panamanians | 96.5 /100 | #114 | Exceptional 24.4% |