Australian vs Immigrants from Cambodia Wage/Income Gap
COMPARE
Australian
Immigrants from Cambodia
Wage/Income Gap
Wage/Income Gap Comparison
Australians
Immigrants from Cambodia
28.2%
WAGE/INCOME GAP
0.3/ 100
METRIC RATING
290th/ 347
METRIC RANK
23.3%
WAGE/INCOME GAP
99.7/ 100
METRIC RATING
85th/ 347
METRIC RANK
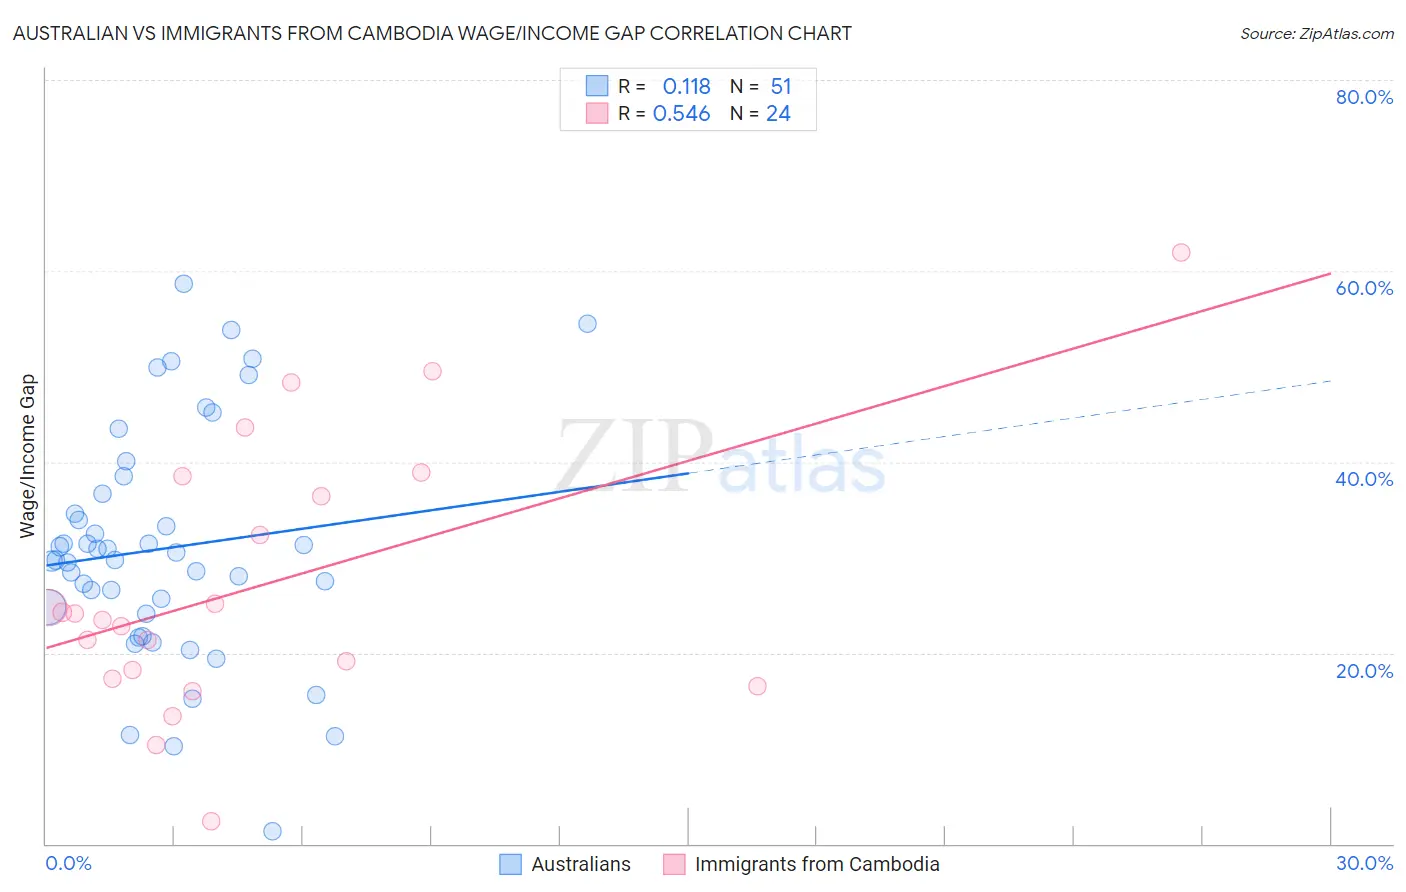
Australian vs Immigrants from Cambodia Wage/Income Gap Correlation Chart
The statistical analysis conducted on geographies consisting of 224,081,810 people shows a poor positive correlation between the proportion of Australians and wage/income gap percentage in the United States with a correlation coefficient (R) of 0.118 and weighted average of 28.2%. Similarly, the statistical analysis conducted on geographies consisting of 205,133,865 people shows a substantial positive correlation between the proportion of Immigrants from Cambodia and wage/income gap percentage in the United States with a correlation coefficient (R) of 0.546 and weighted average of 23.3%, a difference of 21.0%.
Wage/Income Gap Correlation Summary
| Measurement | Australian | Immigrants from Cambodia |
| Minimum | 1.3% | 2.3% |
| Maximum | 58.7% | 61.9% |
| Range | 57.4% | 59.6% |
| Mean | 30.9% | 27.1% |
| Median | 29.8% | 23.8% |
| Interquartile 25% (IQ1) | 24.1% | 17.8% |
| Interquartile 75% (IQ3) | 36.7% | 37.4% |
| Interquartile Range (IQR) | 12.6% | 19.7% |
| Standard Deviation (Sample) | 12.2% | 14.0% |
| Standard Deviation (Population) | 12.1% | 13.7% |
Similar Demographics by Wage/Income Gap
Demographics Similar to Australians by Wage/Income Gap
In terms of wage/income gap, the demographic groups most similar to Australians are Czechoslovakian (28.2%, a difference of 0.070%), Canadian (28.1%, a difference of 0.090%), Immigrants from Australia (28.2%, a difference of 0.12%), Choctaw (28.1%, a difference of 0.13%), and Okinawan (28.1%, a difference of 0.16%).
| Demographics | Rating | Rank | Wage/Income Gap |
| French Canadians | 0.4 /100 | #283 | Tragic 28.1% |
| Immigrants | Sweden | 0.4 /100 | #284 | Tragic 28.1% |
| Italians | 0.4 /100 | #285 | Tragic 28.1% |
| Immigrants | Austria | 0.4 /100 | #286 | Tragic 28.1% |
| Okinawans | 0.4 /100 | #287 | Tragic 28.1% |
| Choctaw | 0.4 /100 | #288 | Tragic 28.1% |
| Canadians | 0.3 /100 | #289 | Tragic 28.1% |
| Australians | 0.3 /100 | #290 | Tragic 28.2% |
| Czechoslovakians | 0.3 /100 | #291 | Tragic 28.2% |
| Immigrants | Australia | 0.3 /100 | #292 | Tragic 28.2% |
| Immigrants | Israel | 0.3 /100 | #293 | Tragic 28.2% |
| Greeks | 0.3 /100 | #294 | Tragic 28.2% |
| Slovenes | 0.3 /100 | #295 | Tragic 28.3% |
| Northern Europeans | 0.3 /100 | #296 | Tragic 28.3% |
| Immigrants | North America | 0.2 /100 | #297 | Tragic 28.4% |
Demographics Similar to Immigrants from Cambodia by Wage/Income Gap
In terms of wage/income gap, the demographic groups most similar to Immigrants from Cambodia are Cuban (23.3%, a difference of 0.050%), Cheyenne (23.3%, a difference of 0.20%), Yuman (23.3%, a difference of 0.25%), Immigrants from Africa (23.2%, a difference of 0.43%), and Immigrants from Panama (23.4%, a difference of 0.57%).
| Demographics | Rating | Rank | Wage/Income Gap |
| Nigerians | 99.9 /100 | #78 | Exceptional 23.0% |
| Immigrants | Nicaragua | 99.9 /100 | #79 | Exceptional 23.0% |
| Salvadorans | 99.9 /100 | #80 | Exceptional 23.0% |
| Bermudans | 99.8 /100 | #81 | Exceptional 23.1% |
| Central Americans | 99.8 /100 | #82 | Exceptional 23.1% |
| Immigrants | Africa | 99.8 /100 | #83 | Exceptional 23.2% |
| Cubans | 99.7 /100 | #84 | Exceptional 23.3% |
| Immigrants | Cambodia | 99.7 /100 | #85 | Exceptional 23.3% |
| Cheyenne | 99.7 /100 | #86 | Exceptional 23.3% |
| Yuman | 99.7 /100 | #87 | Exceptional 23.3% |
| Immigrants | Panama | 99.6 /100 | #88 | Exceptional 23.4% |
| Marshallese | 99.6 /100 | #89 | Exceptional 23.4% |
| Nicaraguans | 99.6 /100 | #90 | Exceptional 23.4% |
| Arapaho | 99.6 /100 | #91 | Exceptional 23.5% |
| Immigrants | Honduras | 99.5 /100 | #92 | Exceptional 23.5% |