Immigrants from England vs Cape Verdean Wage/Income Gap
COMPARE
Immigrants from England
Cape Verdean
Wage/Income Gap
Wage/Income Gap Comparison
Immigrants from England
Cape Verdeans
27.9%
WAGE/INCOME GAP
0.6/ 100
METRIC RATING
278th/ 347
METRIC RANK
23.6%
WAGE/INCOME GAP
99.4/ 100
METRIC RATING
95th/ 347
METRIC RANK
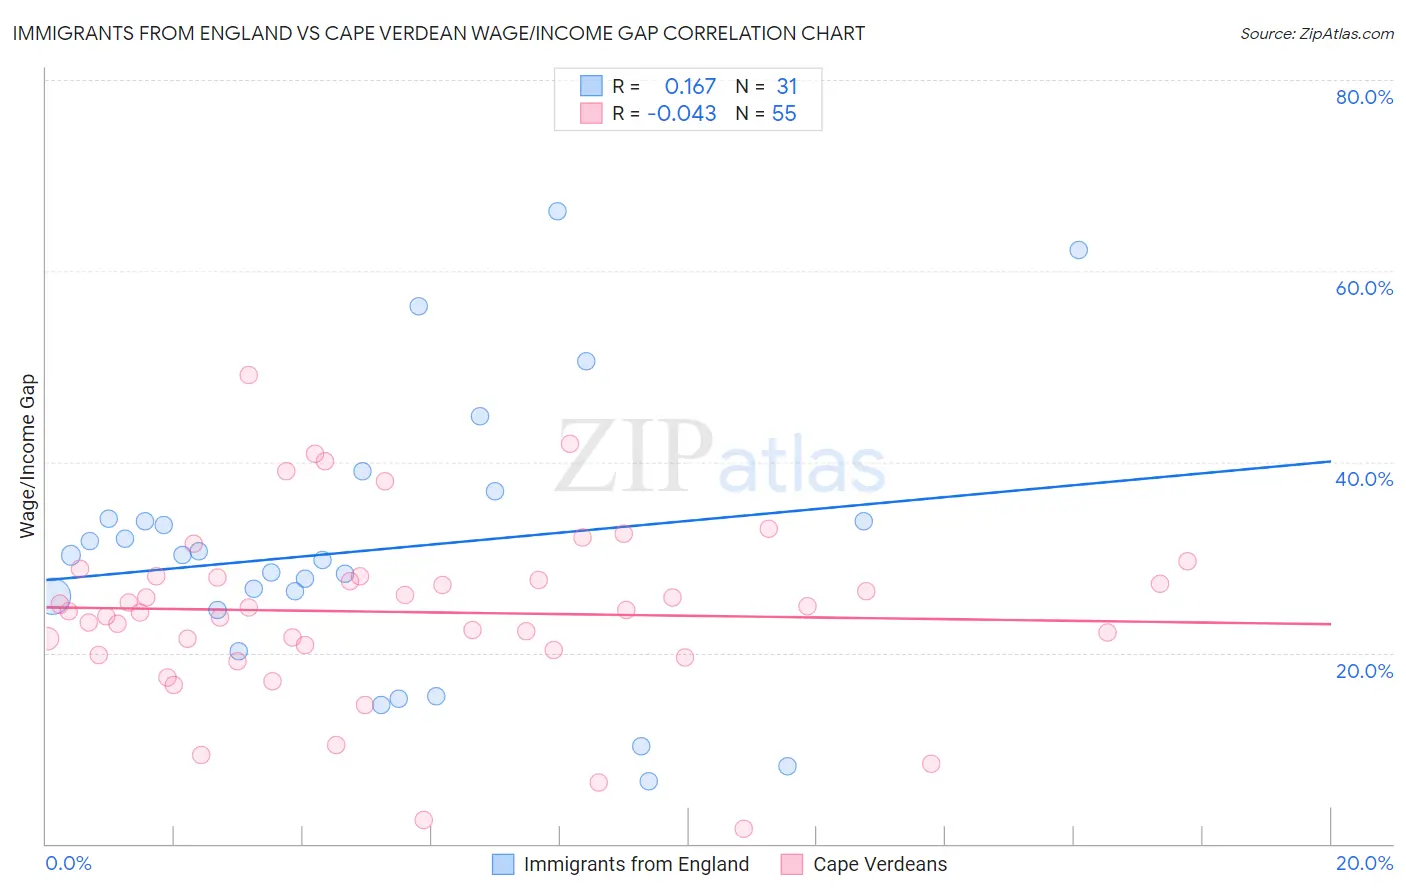
Immigrants from England vs Cape Verdean Wage/Income Gap Correlation Chart
The statistical analysis conducted on geographies consisting of 391,474,935 people shows a poor positive correlation between the proportion of Immigrants from England and wage/income gap percentage in the United States with a correlation coefficient (R) of 0.167 and weighted average of 27.9%. Similarly, the statistical analysis conducted on geographies consisting of 107,547,548 people shows no correlation between the proportion of Cape Verdeans and wage/income gap percentage in the United States with a correlation coefficient (R) of -0.043 and weighted average of 23.6%, a difference of 18.3%.
Wage/Income Gap Correlation Summary
| Measurement | Immigrants from England | Cape Verdean |
| Minimum | 6.6% | 1.5% |
| Maximum | 66.3% | 49.0% |
| Range | 59.7% | 47.5% |
| Mean | 30.8% | 24.3% |
| Median | 30.2% | 24.5% |
| Interquartile 25% (IQ1) | 24.5% | 20.3% |
| Interquartile 75% (IQ3) | 34.1% | 28.0% |
| Interquartile Range (IQR) | 9.6% | 7.6% |
| Standard Deviation (Sample) | 14.3% | 9.2% |
| Standard Deviation (Population) | 14.0% | 9.2% |
Similar Demographics by Wage/Income Gap
Demographics Similar to Immigrants from England by Wage/Income Gap
In terms of wage/income gap, the demographic groups most similar to Immigrants from England are Lebanese (27.9%, a difference of 0.080%), Latvian (27.9%, a difference of 0.080%), Immigrants from Japan (27.9%, a difference of 0.11%), American (27.8%, a difference of 0.19%), and Bulgarian (27.8%, a difference of 0.23%).
| Demographics | Rating | Rank | Wage/Income Gap |
| Ute | 0.8 /100 | #271 | Tragic 27.8% |
| Immigrants | Korea | 0.8 /100 | #272 | Tragic 27.8% |
| Bulgarians | 0.7 /100 | #273 | Tragic 27.8% |
| Americans | 0.7 /100 | #274 | Tragic 27.8% |
| Immigrants | Japan | 0.7 /100 | #275 | Tragic 27.9% |
| Lebanese | 0.7 /100 | #276 | Tragic 27.9% |
| Latvians | 0.7 /100 | #277 | Tragic 27.9% |
| Immigrants | England | 0.6 /100 | #278 | Tragic 27.9% |
| Romanians | 0.5 /100 | #279 | Tragic 28.0% |
| Russians | 0.5 /100 | #280 | Tragic 28.0% |
| Burmese | 0.5 /100 | #281 | Tragic 28.0% |
| South Africans | 0.5 /100 | #282 | Tragic 28.0% |
| French Canadians | 0.4 /100 | #283 | Tragic 28.1% |
| Immigrants | Sweden | 0.4 /100 | #284 | Tragic 28.1% |
| Italians | 0.4 /100 | #285 | Tragic 28.1% |
Demographics Similar to Cape Verdeans by Wage/Income Gap
In terms of wage/income gap, the demographic groups most similar to Cape Verdeans are Honduran (23.6%, a difference of 0.030%), Immigrants from Cabo Verde (23.6%, a difference of 0.12%), Kiowa (23.6%, a difference of 0.12%), Immigrants from Sudan (23.6%, a difference of 0.21%), and Immigrants from Honduras (23.5%, a difference of 0.36%).
| Demographics | Rating | Rank | Wage/Income Gap |
| Immigrants | Panama | 99.6 /100 | #88 | Exceptional 23.4% |
| Marshallese | 99.6 /100 | #89 | Exceptional 23.4% |
| Nicaraguans | 99.6 /100 | #90 | Exceptional 23.4% |
| Arapaho | 99.6 /100 | #91 | Exceptional 23.5% |
| Immigrants | Honduras | 99.5 /100 | #92 | Exceptional 23.5% |
| Immigrants | Cabo Verde | 99.5 /100 | #93 | Exceptional 23.6% |
| Hondurans | 99.5 /100 | #94 | Exceptional 23.6% |
| Cape Verdeans | 99.4 /100 | #95 | Exceptional 23.6% |
| Kiowa | 99.4 /100 | #96 | Exceptional 23.6% |
| Immigrants | Sudan | 99.4 /100 | #97 | Exceptional 23.6% |
| Immigrants | Latin America | 99.2 /100 | #98 | Exceptional 23.7% |
| Aleuts | 99.2 /100 | #99 | Exceptional 23.7% |
| Yakama | 99.2 /100 | #100 | Exceptional 23.7% |
| Japanese | 99.1 /100 | #101 | Exceptional 23.8% |
| Immigrants | Laos | 99.0 /100 | #102 | Exceptional 23.8% |