Russian vs Immigrants from South Africa Median Household Income
COMPARE
Russian
Immigrants from South Africa
Median Household Income
Median Household Income Comparison
Russians
Immigrants from South Africa
$98,008
MEDIAN HOUSEHOLD INCOME
100.0/ 100
METRIC RATING
34th/ 347
METRIC RANK
$95,800
MEDIAN HOUSEHOLD INCOME
99.9/ 100
METRIC RATING
52nd/ 347
METRIC RANK
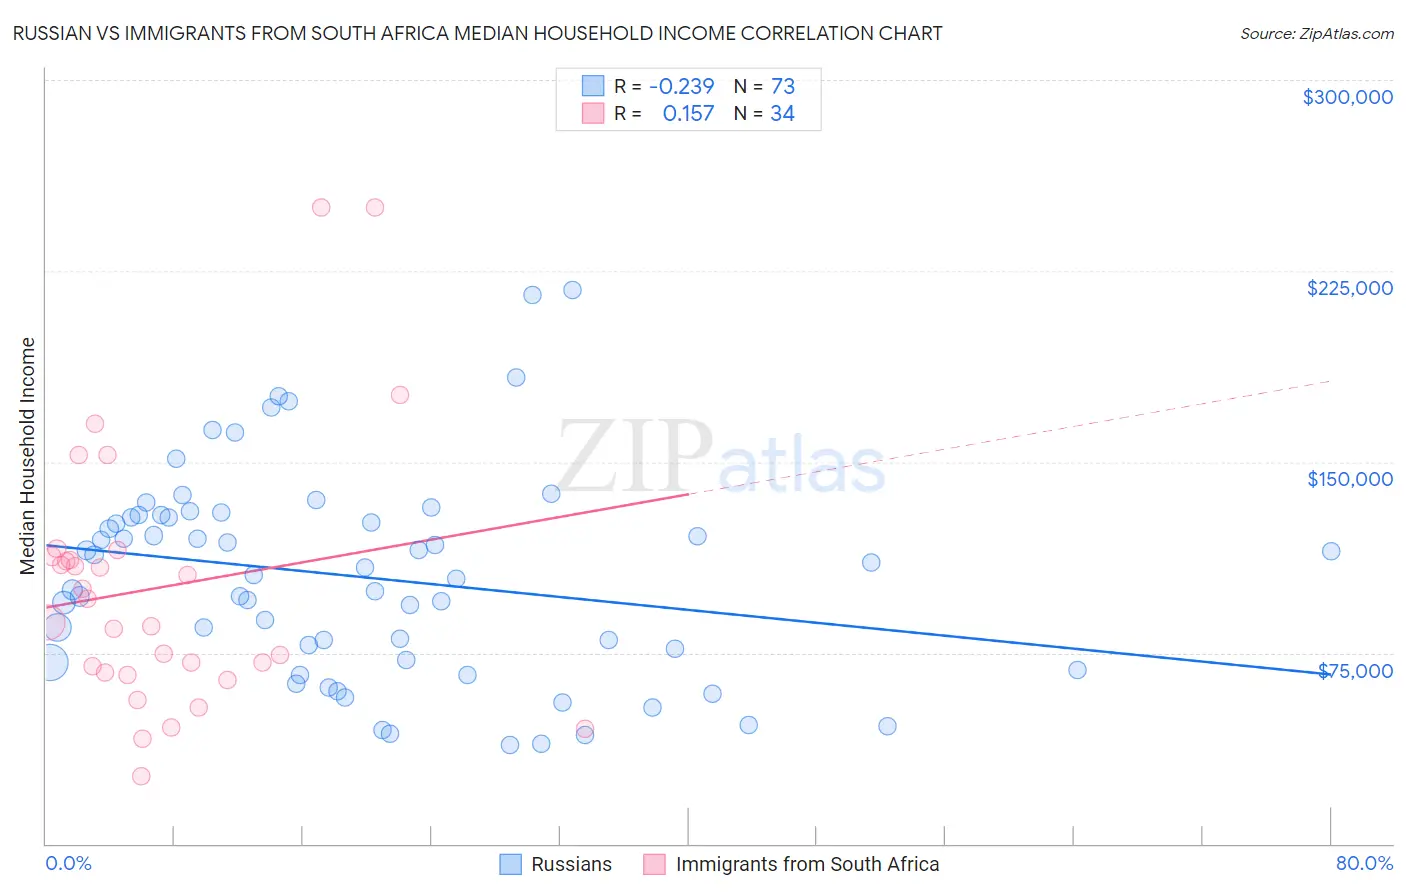
Russian vs Immigrants from South Africa Median Household Income Correlation Chart
The statistical analysis conducted on geographies consisting of 511,515,990 people shows a weak negative correlation between the proportion of Russians and median household income in the United States with a correlation coefficient (R) of -0.239 and weighted average of $98,008. Similarly, the statistical analysis conducted on geographies consisting of 233,255,435 people shows a poor positive correlation between the proportion of Immigrants from South Africa and median household income in the United States with a correlation coefficient (R) of 0.157 and weighted average of $95,800, a difference of 2.3%.
Median Household Income Correlation Summary
| Measurement | Russian | Immigrants from South Africa |
| Minimum | $38,750 | $26,321 |
| Maximum | $217,375 | $250,001 |
| Range | $178,625 | $223,680 |
| Mean | $104,714 | $100,741 |
| Median | $105,523 | $91,620 |
| Interquartile 25% (IQ1) | $71,539 | $67,153 |
| Interquartile 75% (IQ3) | $128,679 | $112,945 |
| Interquartile Range (IQR) | $57,140 | $45,792 |
| Standard Deviation (Sample) | $40,584 | $51,810 |
| Standard Deviation (Population) | $40,305 | $51,042 |
Demographics Similar to Russians and Immigrants from South Africa by Median Household Income
In terms of median household income, the demographic groups most similar to Russians are Immigrants from Switzerland ($97,979, a difference of 0.030%), Immigrants from Pakistan ($97,528, a difference of 0.49%), Chinese ($98,496, a difference of 0.50%), Latvian ($97,311, a difference of 0.72%), and Immigrants from Indonesia ($97,297, a difference of 0.73%). Similarly, the demographic groups most similar to Immigrants from South Africa are Paraguayan ($95,737, a difference of 0.070%), Estonian ($95,930, a difference of 0.14%), Immigrants from Malaysia ($96,292, a difference of 0.51%), Bulgarian ($96,290, a difference of 0.51%), and Cambodian ($96,324, a difference of 0.55%).
| Demographics | Rating | Rank | Median Household Income |
| Chinese | 100.0 /100 | #33 | Exceptional $98,496 |
| Russians | 100.0 /100 | #34 | Exceptional $98,008 |
| Immigrants | Switzerland | 100.0 /100 | #35 | Exceptional $97,979 |
| Immigrants | Pakistan | 100.0 /100 | #36 | Exceptional $97,528 |
| Latvians | 100.0 /100 | #37 | Exceptional $97,311 |
| Immigrants | Indonesia | 100.0 /100 | #38 | Exceptional $97,297 |
| Afghans | 100.0 /100 | #39 | Exceptional $97,026 |
| Maltese | 100.0 /100 | #40 | Exceptional $97,015 |
| Immigrants | Turkey | 100.0 /100 | #41 | Exceptional $96,964 |
| Immigrants | Lithuania | 99.9 /100 | #42 | Exceptional $96,836 |
| Immigrants | France | 99.9 /100 | #43 | Exceptional $96,743 |
| Immigrants | Greece | 99.9 /100 | #44 | Exceptional $96,675 |
| Israelis | 99.9 /100 | #45 | Exceptional $96,552 |
| Australians | 99.9 /100 | #46 | Exceptional $96,490 |
| Immigrants | Russia | 99.9 /100 | #47 | Exceptional $96,378 |
| Cambodians | 99.9 /100 | #48 | Exceptional $96,324 |
| Immigrants | Malaysia | 99.9 /100 | #49 | Exceptional $96,292 |
| Bulgarians | 99.9 /100 | #50 | Exceptional $96,290 |
| Estonians | 99.9 /100 | #51 | Exceptional $95,930 |
| Immigrants | South Africa | 99.9 /100 | #52 | Exceptional $95,800 |
| Paraguayans | 99.9 /100 | #53 | Exceptional $95,737 |