Cree vs Immigrants from South Africa Median Household Income
COMPARE
Cree
Immigrants from South Africa
Median Household Income
Median Household Income Comparison
Cree
Immigrants from South Africa
$74,685
MEDIAN HOUSEHOLD INCOME
0.1/ 100
METRIC RATING
283rd/ 347
METRIC RANK
$95,800
MEDIAN HOUSEHOLD INCOME
99.9/ 100
METRIC RATING
52nd/ 347
METRIC RANK
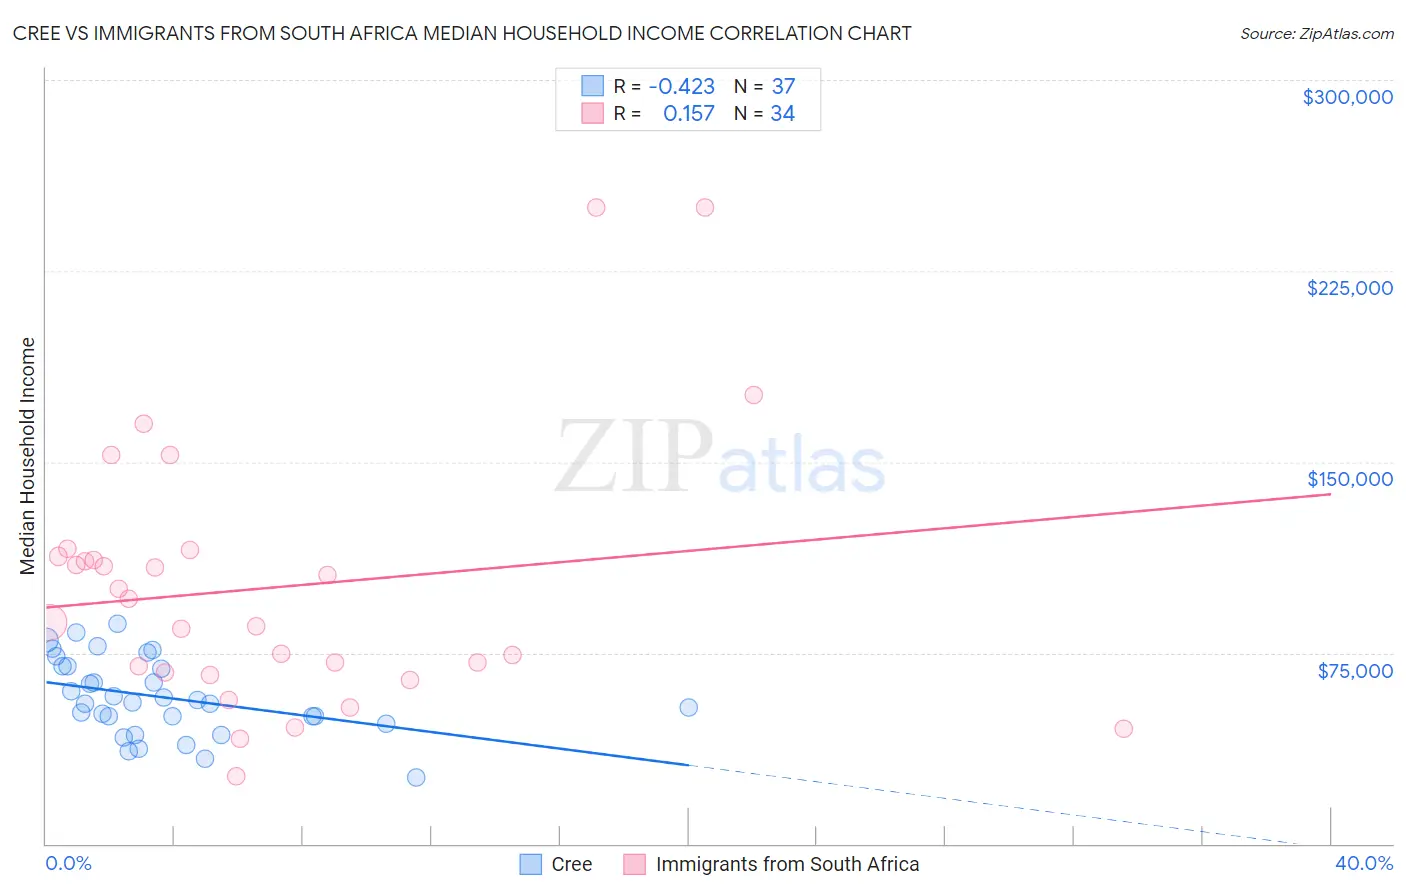
Cree vs Immigrants from South Africa Median Household Income Correlation Chart
The statistical analysis conducted on geographies consisting of 76,206,119 people shows a moderate negative correlation between the proportion of Cree and median household income in the United States with a correlation coefficient (R) of -0.423 and weighted average of $74,685. Similarly, the statistical analysis conducted on geographies consisting of 233,255,435 people shows a poor positive correlation between the proportion of Immigrants from South Africa and median household income in the United States with a correlation coefficient (R) of 0.157 and weighted average of $95,800, a difference of 28.3%.
Median Household Income Correlation Summary
| Measurement | Cree | Immigrants from South Africa |
| Minimum | $25,833 | $26,321 |
| Maximum | $86,509 | $250,001 |
| Range | $60,676 | $223,680 |
| Mean | $57,468 | $100,741 |
| Median | $55,368 | $91,620 |
| Interquartile 25% (IQ1) | $48,609 | $67,153 |
| Interquartile 75% (IQ3) | $69,690 | $112,945 |
| Interquartile Range (IQR) | $21,081 | $45,792 |
| Standard Deviation (Sample) | $14,992 | $51,810 |
| Standard Deviation (Population) | $14,788 | $51,042 |
Similar Demographics by Median Household Income
Demographics Similar to Cree by Median Household Income
In terms of median household income, the demographic groups most similar to Cree are Yaqui ($74,596, a difference of 0.12%), Central American Indian ($74,847, a difference of 0.22%), Immigrants from Liberia ($74,896, a difference of 0.28%), Mexican ($74,399, a difference of 0.39%), and Senegalese ($74,999, a difference of 0.42%).
| Demographics | Rating | Rank | Median Household Income |
| Immigrants | Latin America | 0.2 /100 | #276 | Tragic $75,420 |
| Spanish Americans | 0.2 /100 | #277 | Tragic $75,386 |
| Osage | 0.2 /100 | #278 | Tragic $75,240 |
| Immigrants | Guatemala | 0.2 /100 | #279 | Tragic $75,123 |
| Senegalese | 0.2 /100 | #280 | Tragic $74,999 |
| Immigrants | Liberia | 0.1 /100 | #281 | Tragic $74,896 |
| Central American Indians | 0.1 /100 | #282 | Tragic $74,847 |
| Cree | 0.1 /100 | #283 | Tragic $74,685 |
| Yaqui | 0.1 /100 | #284 | Tragic $74,596 |
| Mexicans | 0.1 /100 | #285 | Tragic $74,399 |
| Immigrants | Somalia | 0.1 /100 | #286 | Tragic $74,300 |
| Iroquois | 0.1 /100 | #287 | Tragic $74,279 |
| Immigrants | Central America | 0.1 /100 | #288 | Tragic $74,217 |
| Fijians | 0.1 /100 | #289 | Tragic $74,205 |
| Bangladeshis | 0.1 /100 | #290 | Tragic $74,112 |
Demographics Similar to Immigrants from South Africa by Median Household Income
In terms of median household income, the demographic groups most similar to Immigrants from South Africa are Paraguayan ($95,737, a difference of 0.070%), Egyptian ($95,673, a difference of 0.13%), Estonian ($95,930, a difference of 0.14%), Immigrants from Czechoslovakia ($95,319, a difference of 0.50%), and Immigrants from Malaysia ($96,292, a difference of 0.51%).
| Demographics | Rating | Rank | Median Household Income |
| Israelis | 99.9 /100 | #45 | Exceptional $96,552 |
| Australians | 99.9 /100 | #46 | Exceptional $96,490 |
| Immigrants | Russia | 99.9 /100 | #47 | Exceptional $96,378 |
| Cambodians | 99.9 /100 | #48 | Exceptional $96,324 |
| Immigrants | Malaysia | 99.9 /100 | #49 | Exceptional $96,292 |
| Bulgarians | 99.9 /100 | #50 | Exceptional $96,290 |
| Estonians | 99.9 /100 | #51 | Exceptional $95,930 |
| Immigrants | South Africa | 99.9 /100 | #52 | Exceptional $95,800 |
| Paraguayans | 99.9 /100 | #53 | Exceptional $95,737 |
| Egyptians | 99.9 /100 | #54 | Exceptional $95,673 |
| Immigrants | Czechoslovakia | 99.9 /100 | #55 | Exceptional $95,319 |
| Immigrants | Austria | 99.9 /100 | #56 | Exceptional $95,277 |
| New Zealanders | 99.8 /100 | #57 | Exceptional $95,146 |
| Soviet Union | 99.8 /100 | #58 | Exceptional $95,098 |
| Immigrants | Europe | 99.8 /100 | #59 | Exceptional $95,032 |