Pueblo vs Native/Alaskan Median Male Earnings
COMPARE
Pueblo
Native/Alaskan
Median Male Earnings
Median Male Earnings Comparison
Pueblo
Natives/Alaskans
$41,314
MEDIAN MALE EARNINGS
0.0/ 100
METRIC RATING
344th/ 347
METRIC RANK
$44,775
MEDIAN MALE EARNINGS
0.0/ 100
METRIC RATING
331st/ 347
METRIC RANK
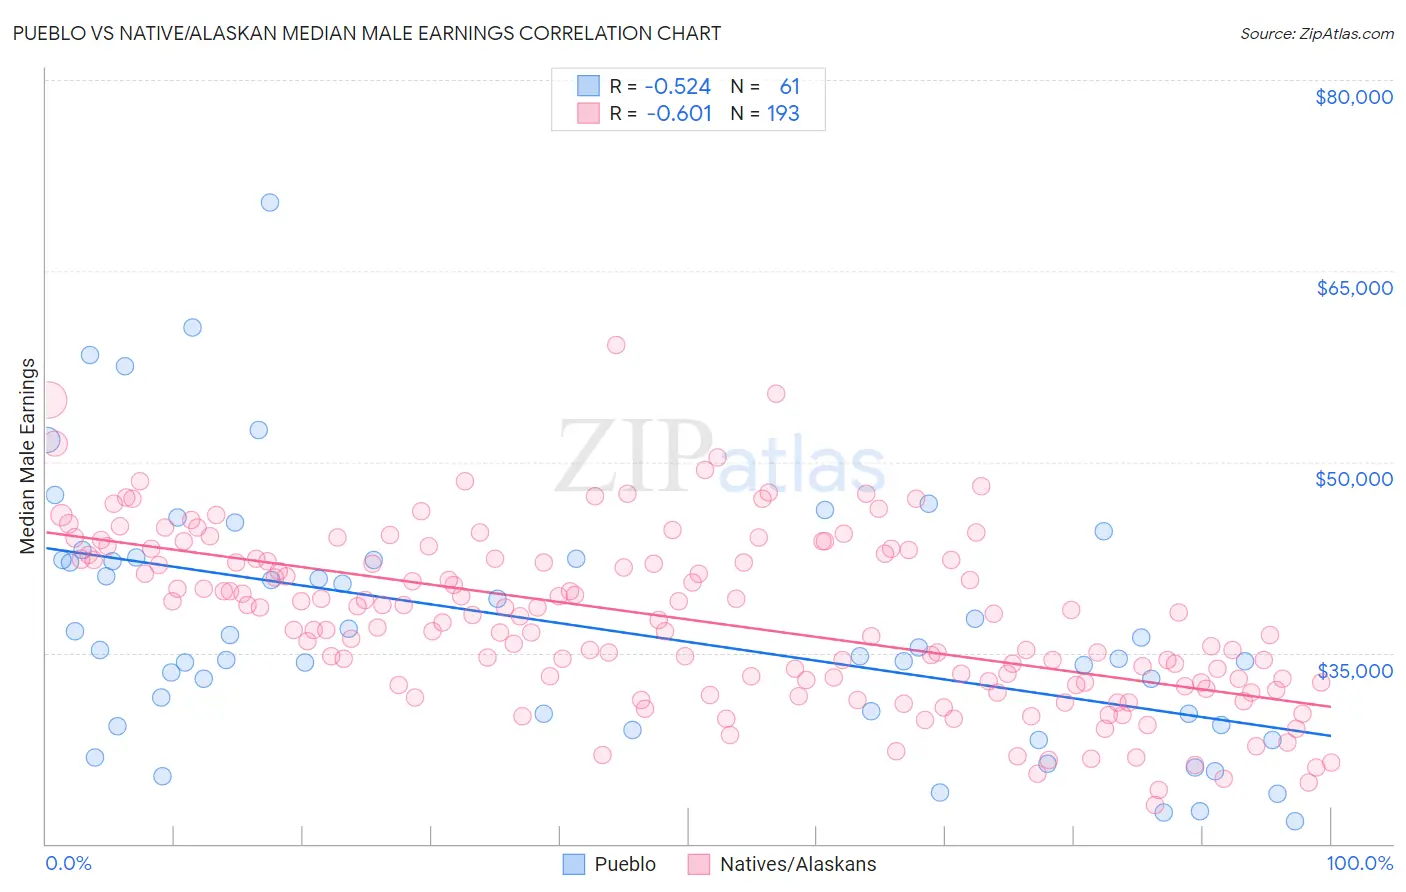
Pueblo vs Native/Alaskan Median Male Earnings Correlation Chart
The statistical analysis conducted on geographies consisting of 120,058,056 people shows a substantial negative correlation between the proportion of Pueblo and median male earnings in the United States with a correlation coefficient (R) of -0.524 and weighted average of $41,314. Similarly, the statistical analysis conducted on geographies consisting of 512,408,867 people shows a significant negative correlation between the proportion of Natives/Alaskans and median male earnings in the United States with a correlation coefficient (R) of -0.601 and weighted average of $44,775, a difference of 8.4%.
Median Male Earnings Correlation Summary
| Measurement | Pueblo | Native/Alaskan |
| Minimum | $21,750 | $23,050 |
| Maximum | $70,357 | $59,216 |
| Range | $48,607 | $36,166 |
| Mean | $37,142 | $37,642 |
| Median | $35,266 | $37,848 |
| Interquartile 25% (IQ1) | $29,777 | $32,642 |
| Interquartile 75% (IQ3) | $42,334 | $42,387 |
| Interquartile Range (IQR) | $12,557 | $9,745 |
| Standard Deviation (Sample) | $9,968 | $6,692 |
| Standard Deviation (Population) | $9,886 | $6,675 |
Demographics Similar to Pueblo and Natives/Alaskans by Median Male Earnings
In terms of median male earnings, the demographic groups most similar to Pueblo are Lumbee ($41,715, a difference of 0.97%), Arapaho ($41,758, a difference of 1.1%), Hopi ($42,060, a difference of 1.8%), Navajo ($42,098, a difference of 1.9%), and Pima ($42,357, a difference of 2.5%). Similarly, the demographic groups most similar to Natives/Alaskans are Bahamian ($44,756, a difference of 0.040%), Immigrants from Mexico ($44,960, a difference of 0.41%), Yakama ($45,002, a difference of 0.51%), Kiowa ($45,094, a difference of 0.71%), and Immigrants from Bahamas ($45,176, a difference of 0.90%).
| Demographics | Rating | Rank | Median Male Earnings |
| Immigrants | Bahamas | 0.0 /100 | #327 | Tragic $45,176 |
| Kiowa | 0.0 /100 | #328 | Tragic $45,094 |
| Yakama | 0.0 /100 | #329 | Tragic $45,002 |
| Immigrants | Mexico | 0.0 /100 | #330 | Tragic $44,960 |
| Natives/Alaskans | 0.0 /100 | #331 | Tragic $44,775 |
| Bahamians | 0.0 /100 | #332 | Tragic $44,756 |
| Immigrants | Congo | 0.0 /100 | #333 | Tragic $44,204 |
| Immigrants | Yemen | 0.0 /100 | #334 | Tragic $44,083 |
| Spanish American Indians | 0.0 /100 | #335 | Tragic $44,010 |
| Immigrants | Cuba | 0.0 /100 | #336 | Tragic $43,461 |
| Menominee | 0.0 /100 | #337 | Tragic $42,581 |
| Crow | 0.0 /100 | #338 | Tragic $42,434 |
| Pima | 0.0 /100 | #339 | Tragic $42,357 |
| Navajo | 0.0 /100 | #340 | Tragic $42,098 |
| Hopi | 0.0 /100 | #341 | Tragic $42,060 |
| Arapaho | 0.0 /100 | #342 | Tragic $41,758 |
| Lumbee | 0.0 /100 | #343 | Tragic $41,715 |
| Pueblo | 0.0 /100 | #344 | Tragic $41,314 |
| Puerto Ricans | 0.0 /100 | #345 | Tragic $40,071 |
| Tohono O'odham | 0.0 /100 | #346 | Tragic $39,543 |
| Yup'ik | 0.0 /100 | #347 | Tragic $39,504 |