Pueblo vs Guyanese Median Male Earnings
COMPARE
Pueblo
Guyanese
Median Male Earnings
Median Male Earnings Comparison
Pueblo
Guyanese
$41,314
MEDIAN MALE EARNINGS
0.0/ 100
METRIC RATING
344th/ 347
METRIC RANK
$50,613
MEDIAN MALE EARNINGS
2.2/ 100
METRIC RATING
242nd/ 347
METRIC RANK
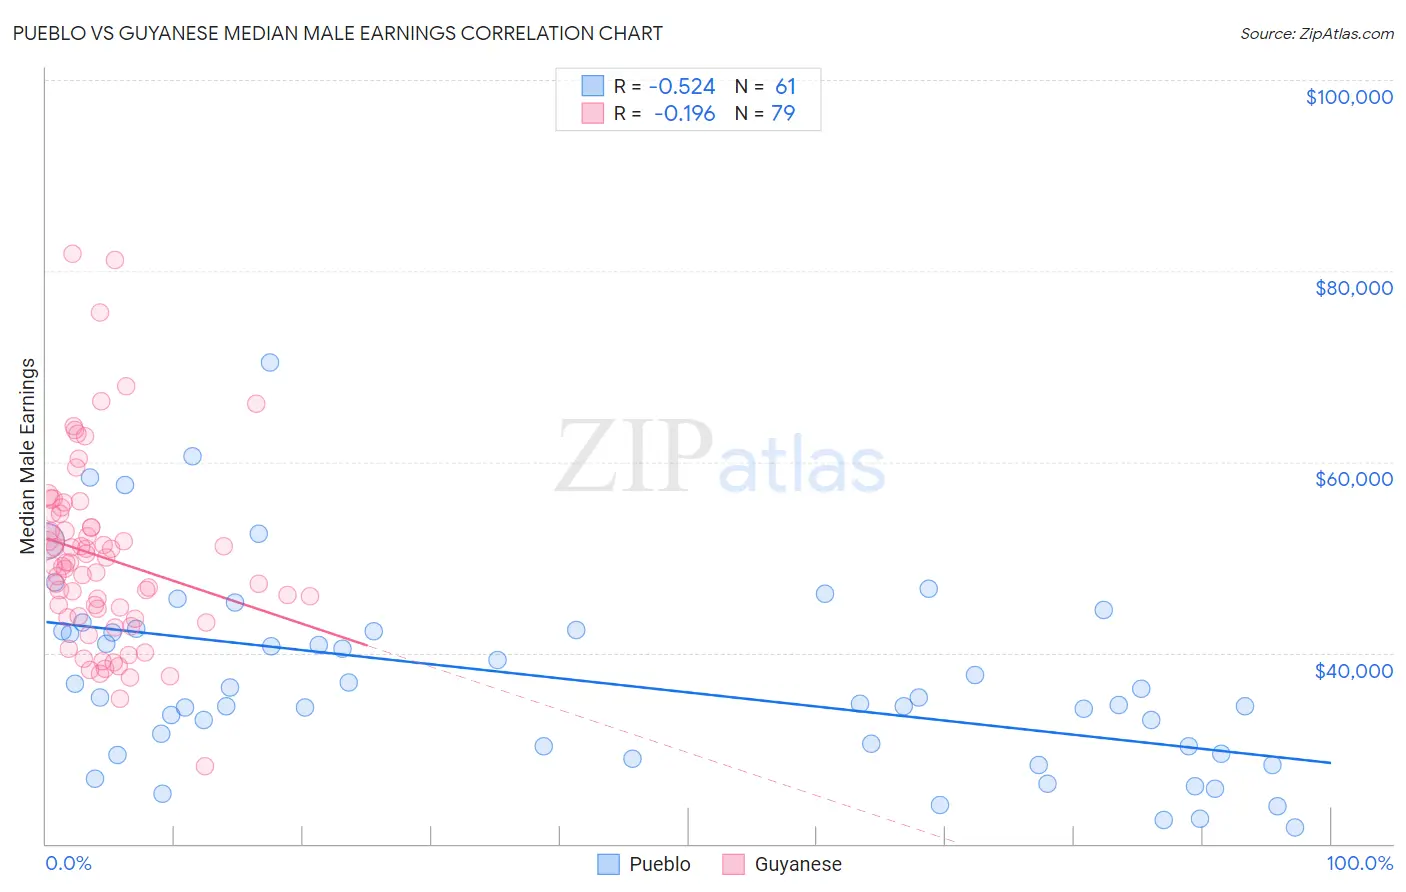
Pueblo vs Guyanese Median Male Earnings Correlation Chart
The statistical analysis conducted on geographies consisting of 120,058,056 people shows a substantial negative correlation between the proportion of Pueblo and median male earnings in the United States with a correlation coefficient (R) of -0.524 and weighted average of $41,314. Similarly, the statistical analysis conducted on geographies consisting of 176,926,771 people shows a poor negative correlation between the proportion of Guyanese and median male earnings in the United States with a correlation coefficient (R) of -0.196 and weighted average of $50,613, a difference of 22.5%.
Median Male Earnings Correlation Summary
| Measurement | Pueblo | Guyanese |
| Minimum | $21,750 | $28,099 |
| Maximum | $70,357 | $81,815 |
| Range | $48,607 | $53,716 |
| Mean | $37,142 | $50,024 |
| Median | $35,266 | $49,104 |
| Interquartile 25% (IQ1) | $29,777 | $43,659 |
| Interquartile 75% (IQ3) | $42,334 | $54,533 |
| Interquartile Range (IQR) | $12,557 | $10,874 |
| Standard Deviation (Sample) | $9,968 | $9,787 |
| Standard Deviation (Population) | $9,886 | $9,725 |
Similar Demographics by Median Male Earnings
Demographics Similar to Pueblo by Median Male Earnings
In terms of median male earnings, the demographic groups most similar to Pueblo are Lumbee ($41,715, a difference of 0.97%), Arapaho ($41,758, a difference of 1.1%), Hopi ($42,060, a difference of 1.8%), Navajo ($42,098, a difference of 1.9%), and Pima ($42,357, a difference of 2.5%).
| Demographics | Rating | Rank | Median Male Earnings |
| Immigrants | Congo | 0.0 /100 | #333 | Tragic $44,204 |
| Immigrants | Yemen | 0.0 /100 | #334 | Tragic $44,083 |
| Spanish American Indians | 0.0 /100 | #335 | Tragic $44,010 |
| Immigrants | Cuba | 0.0 /100 | #336 | Tragic $43,461 |
| Menominee | 0.0 /100 | #337 | Tragic $42,581 |
| Crow | 0.0 /100 | #338 | Tragic $42,434 |
| Pima | 0.0 /100 | #339 | Tragic $42,357 |
| Navajo | 0.0 /100 | #340 | Tragic $42,098 |
| Hopi | 0.0 /100 | #341 | Tragic $42,060 |
| Arapaho | 0.0 /100 | #342 | Tragic $41,758 |
| Lumbee | 0.0 /100 | #343 | Tragic $41,715 |
| Pueblo | 0.0 /100 | #344 | Tragic $41,314 |
| Puerto Ricans | 0.0 /100 | #345 | Tragic $40,071 |
| Tohono O'odham | 0.0 /100 | #346 | Tragic $39,543 |
| Yup'ik | 0.0 /100 | #347 | Tragic $39,504 |
Demographics Similar to Guyanese by Median Male Earnings
In terms of median male earnings, the demographic groups most similar to Guyanese are French American Indian ($50,611, a difference of 0.0%), Immigrants from St. Vincent and the Grenadines ($50,665, a difference of 0.10%), Houma ($50,547, a difference of 0.13%), West Indian ($50,682, a difference of 0.14%), and Hawaiian ($50,488, a difference of 0.25%).
| Demographics | Rating | Rank | Median Male Earnings |
| Immigrants | Western Africa | 3.0 /100 | #235 | Tragic $50,940 |
| Pennsylvania Germans | 2.8 /100 | #236 | Tragic $50,878 |
| Immigrants | Barbados | 2.6 /100 | #237 | Tragic $50,795 |
| Malaysians | 2.5 /100 | #238 | Tragic $50,772 |
| Americans | 2.5 /100 | #239 | Tragic $50,761 |
| West Indians | 2.3 /100 | #240 | Tragic $50,682 |
| Immigrants | St. Vincent and the Grenadines | 2.3 /100 | #241 | Tragic $50,665 |
| Guyanese | 2.2 /100 | #242 | Tragic $50,613 |
| French American Indians | 2.2 /100 | #243 | Tragic $50,611 |
| Houma | 2.0 /100 | #244 | Tragic $50,547 |
| Hawaiians | 1.9 /100 | #245 | Tragic $50,488 |
| Immigrants | Ecuador | 1.9 /100 | #246 | Tragic $50,474 |
| Sub-Saharan Africans | 1.8 /100 | #247 | Tragic $50,408 |
| Immigrants | Guyana | 1.6 /100 | #248 | Tragic $50,321 |
| Immigrants | Burma/Myanmar | 1.6 /100 | #249 | Tragic $50,298 |