Hispanic or Latino vs Native/Alaskan Median Male Earnings
COMPARE
Hispanic or Latino
Native/Alaskan
Median Male Earnings
Median Male Earnings Comparison
Hispanics or Latinos
Natives/Alaskans
$46,419
MEDIAN MALE EARNINGS
0.0/ 100
METRIC RATING
312th/ 347
METRIC RANK
$44,775
MEDIAN MALE EARNINGS
0.0/ 100
METRIC RATING
331st/ 347
METRIC RANK
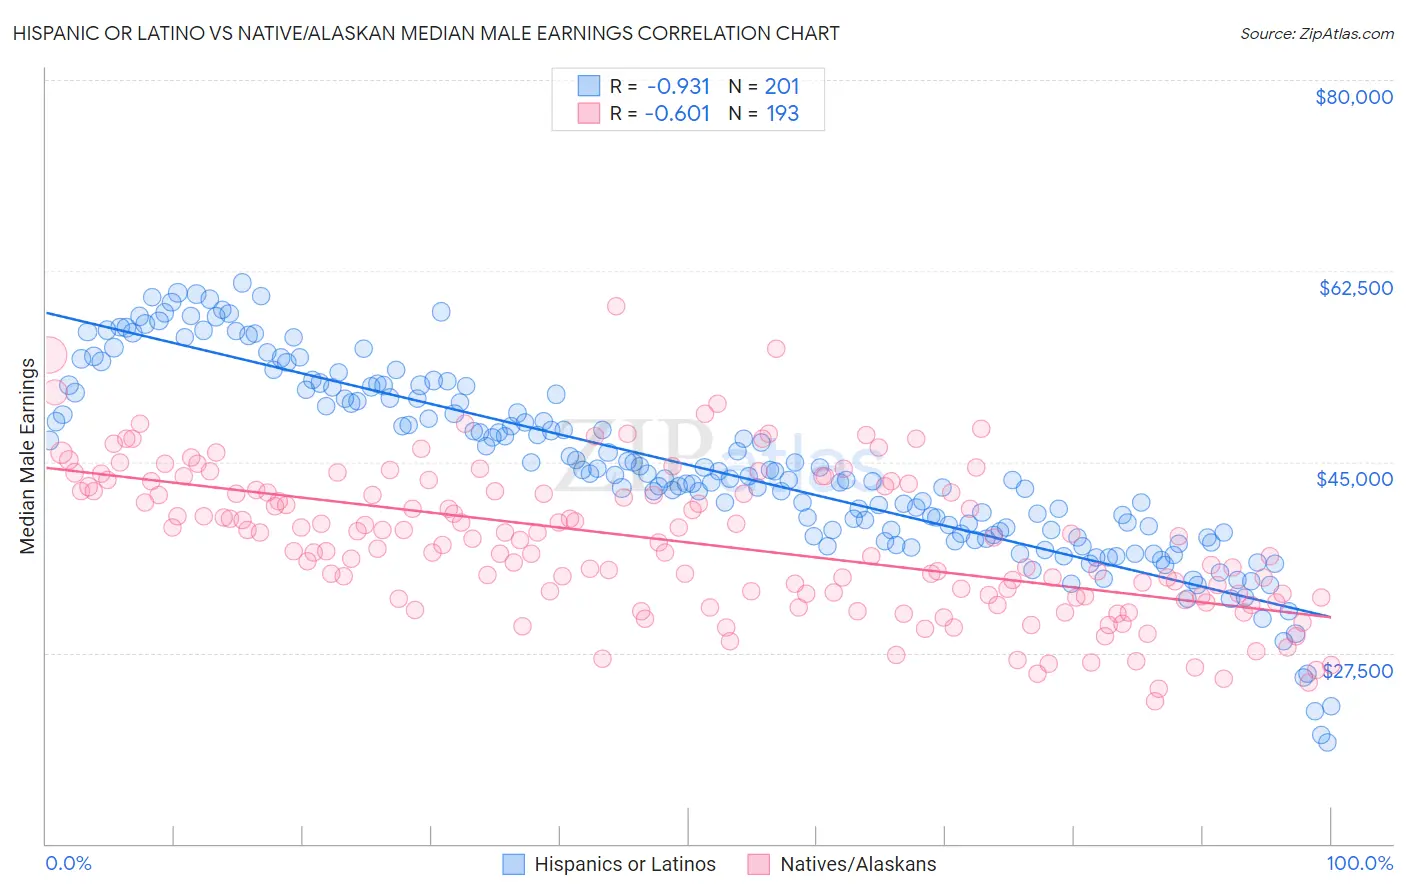
Hispanic or Latino vs Native/Alaskan Median Male Earnings Correlation Chart
The statistical analysis conducted on geographies consisting of 577,008,191 people shows a near-perfect negative correlation between the proportion of Hispanics or Latinos and median male earnings in the United States with a correlation coefficient (R) of -0.931 and weighted average of $46,419. Similarly, the statistical analysis conducted on geographies consisting of 512,408,867 people shows a significant negative correlation between the proportion of Natives/Alaskans and median male earnings in the United States with a correlation coefficient (R) of -0.601 and weighted average of $44,775, a difference of 3.7%.
Median Male Earnings Correlation Summary
| Measurement | Hispanic or Latino | Native/Alaskan |
| Minimum | $19,304 | $23,050 |
| Maximum | $61,420 | $59,216 |
| Range | $42,115 | $36,166 |
| Mean | $44,646 | $37,642 |
| Median | $43,909 | $37,848 |
| Interquartile 25% (IQ1) | $38,393 | $32,642 |
| Interquartile 75% (IQ3) | $51,713 | $42,387 |
| Interquartile Range (IQR) | $13,320 | $9,745 |
| Standard Deviation (Sample) | $8,708 | $6,692 |
| Standard Deviation (Population) | $8,686 | $6,675 |
Demographics Similar to Hispanics or Latinos and Natives/Alaskans by Median Male Earnings
In terms of median male earnings, the demographic groups most similar to Hispanics or Latinos are Apache ($46,429, a difference of 0.020%), Honduran ($46,374, a difference of 0.10%), Chippewa ($46,368, a difference of 0.11%), Immigrants from Guatemala ($46,244, a difference of 0.38%), and Immigrants from Caribbean ($46,193, a difference of 0.49%). Similarly, the demographic groups most similar to Natives/Alaskans are Immigrants from Mexico ($44,960, a difference of 0.41%), Yakama ($45,002, a difference of 0.51%), Kiowa ($45,094, a difference of 0.71%), Immigrants from Bahamas ($45,176, a difference of 0.90%), and Immigrants from Haiti ($45,266, a difference of 1.1%).
| Demographics | Rating | Rank | Median Male Earnings |
| Apache | 0.0 /100 | #311 | Tragic $46,429 |
| Hispanics or Latinos | 0.0 /100 | #312 | Tragic $46,419 |
| Hondurans | 0.0 /100 | #313 | Tragic $46,374 |
| Chippewa | 0.0 /100 | #314 | Tragic $46,368 |
| Immigrants | Guatemala | 0.0 /100 | #315 | Tragic $46,244 |
| Immigrants | Caribbean | 0.0 /100 | #316 | Tragic $46,193 |
| Mexicans | 0.0 /100 | #317 | Tragic $46,147 |
| Cheyenne | 0.0 /100 | #318 | Tragic $46,062 |
| Haitians | 0.0 /100 | #319 | Tragic $45,903 |
| Immigrants | Honduras | 0.0 /100 | #320 | Tragic $45,787 |
| Fijians | 0.0 /100 | #321 | Tragic $45,607 |
| Sioux | 0.0 /100 | #322 | Tragic $45,566 |
| Immigrants | Central America | 0.0 /100 | #323 | Tragic $45,538 |
| Blacks/African Americans | 0.0 /100 | #324 | Tragic $45,523 |
| Yuman | 0.0 /100 | #325 | Tragic $45,446 |
| Immigrants | Haiti | 0.0 /100 | #326 | Tragic $45,266 |
| Immigrants | Bahamas | 0.0 /100 | #327 | Tragic $45,176 |
| Kiowa | 0.0 /100 | #328 | Tragic $45,094 |
| Yakama | 0.0 /100 | #329 | Tragic $45,002 |
| Immigrants | Mexico | 0.0 /100 | #330 | Tragic $44,960 |
| Natives/Alaskans | 0.0 /100 | #331 | Tragic $44,775 |