Portuguese vs Immigrants from Portugal Median Male Earnings
COMPARE
Portuguese
Immigrants from Portugal
Median Male Earnings
Median Male Earnings Comparison
Portuguese
Immigrants from Portugal
$56,663
MEDIAN MALE EARNINGS
89.4/ 100
METRIC RATING
131st/ 347
METRIC RANK
$55,182
MEDIAN MALE EARNINGS
66.3/ 100
METRIC RATING
165th/ 347
METRIC RANK
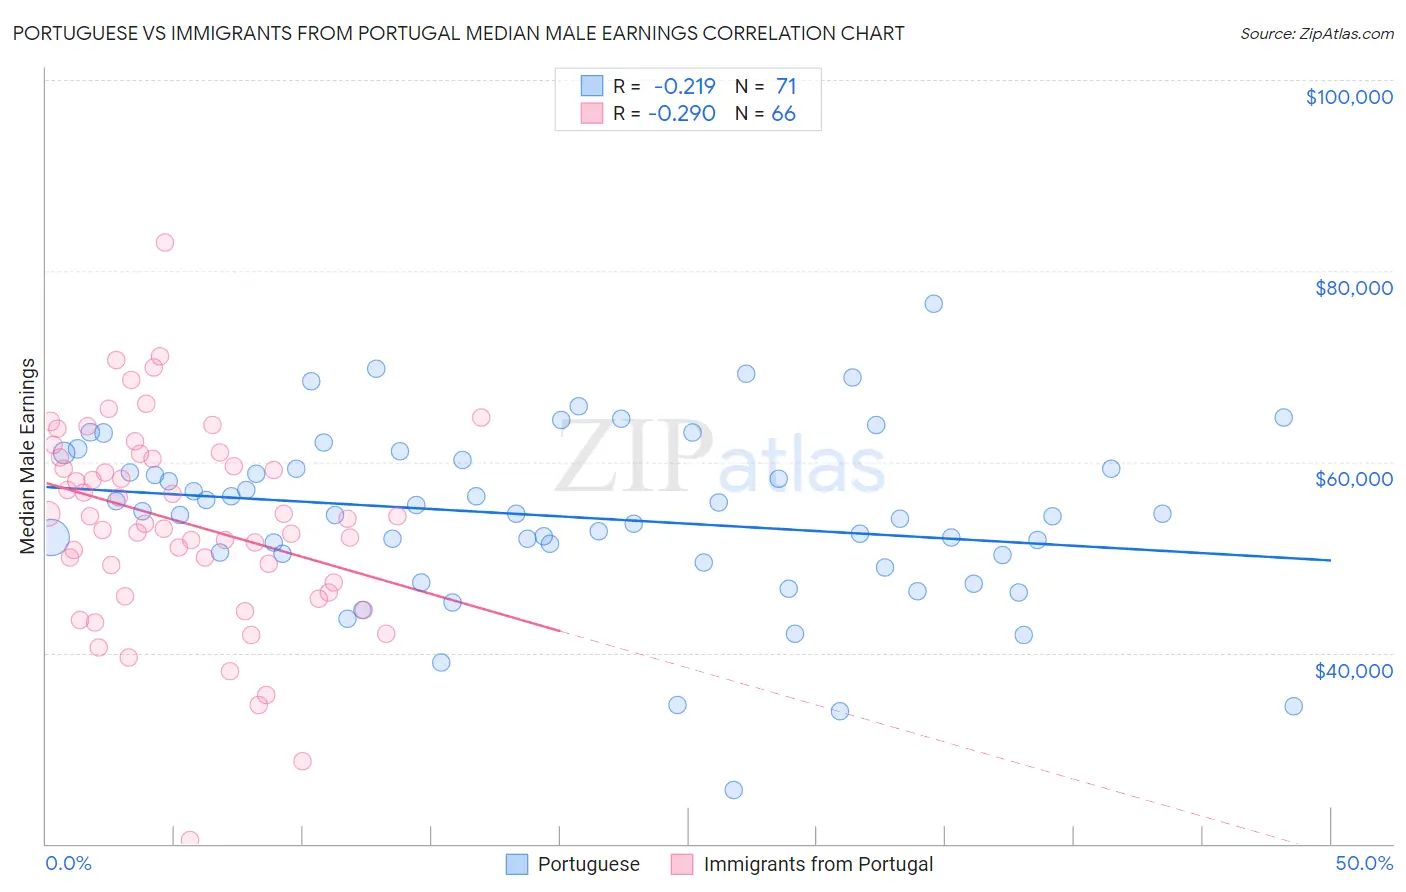
Portuguese vs Immigrants from Portugal Median Male Earnings Correlation Chart
The statistical analysis conducted on geographies consisting of 450,078,327 people shows a weak negative correlation between the proportion of Portuguese and median male earnings in the United States with a correlation coefficient (R) of -0.219 and weighted average of $56,663. Similarly, the statistical analysis conducted on geographies consisting of 174,772,823 people shows a weak negative correlation between the proportion of Immigrants from Portugal and median male earnings in the United States with a correlation coefficient (R) of -0.290 and weighted average of $55,182, a difference of 2.7%.
Median Male Earnings Correlation Summary
| Measurement | Portuguese | Immigrants from Portugal |
| Minimum | $25,598 | $20,417 |
| Maximum | $76,528 | $82,976 |
| Range | $50,930 | $62,559 |
| Mean | $54,293 | $53,702 |
| Median | $54,519 | $54,126 |
| Interquartile 25% (IQ1) | $50,262 | $47,334 |
| Interquartile 75% (IQ3) | $60,181 | $60,481 |
| Interquartile Range (IQR) | $9,919 | $13,147 |
| Standard Deviation (Sample) | $9,132 | $10,627 |
| Standard Deviation (Population) | $9,067 | $10,546 |
Similar Demographics by Median Male Earnings
Demographics Similar to Portuguese by Median Male Earnings
In terms of median male earnings, the demographic groups most similar to Portuguese are Korean ($56,672, a difference of 0.020%), Pakistani ($56,719, a difference of 0.10%), Czech ($56,546, a difference of 0.21%), Immigrants from Germany ($56,542, a difference of 0.21%), and Immigrants from Syria ($56,830, a difference of 0.29%).
| Demographics | Rating | Rank | Median Male Earnings |
| Chileans | 91.9 /100 | #124 | Exceptional $56,973 |
| Immigrants | Morocco | 91.8 /100 | #125 | Exceptional $56,958 |
| Chinese | 91.1 /100 | #126 | Exceptional $56,872 |
| Brazilians | 90.9 /100 | #127 | Exceptional $56,837 |
| Immigrants | Syria | 90.8 /100 | #128 | Exceptional $56,830 |
| Pakistanis | 89.9 /100 | #129 | Excellent $56,719 |
| Koreans | 89.4 /100 | #130 | Excellent $56,672 |
| Portuguese | 89.4 /100 | #131 | Excellent $56,663 |
| Czechs | 88.2 /100 | #132 | Excellent $56,546 |
| Immigrants | Germany | 88.2 /100 | #133 | Excellent $56,542 |
| Moroccans | 87.7 /100 | #134 | Excellent $56,499 |
| Irish | 87.4 /100 | #135 | Excellent $56,464 |
| Immigrants | Saudi Arabia | 87.2 /100 | #136 | Excellent $56,452 |
| Slavs | 86.5 /100 | #137 | Excellent $56,390 |
| Slovaks | 85.5 /100 | #138 | Excellent $56,306 |
Demographics Similar to Immigrants from Portugal by Median Male Earnings
In terms of median male earnings, the demographic groups most similar to Immigrants from Portugal are Immigrants from South Eastern Asia ($55,241, a difference of 0.11%), Ugandan ($55,290, a difference of 0.20%), French ($55,350, a difference of 0.31%), Belgian ($55,361, a difference of 0.32%), and Basque ($55,370, a difference of 0.34%).
| Demographics | Rating | Rank | Median Male Earnings |
| Czechoslovakians | 70.5 /100 | #158 | Good $55,382 |
| Alsatians | 70.5 /100 | #159 | Good $55,380 |
| Basques | 70.3 /100 | #160 | Good $55,370 |
| Belgians | 70.1 /100 | #161 | Good $55,361 |
| French | 69.9 /100 | #162 | Good $55,350 |
| Ugandans | 68.6 /100 | #163 | Good $55,290 |
| Immigrants | South Eastern Asia | 67.6 /100 | #164 | Good $55,241 |
| Immigrants | Portugal | 66.3 /100 | #165 | Good $55,182 |
| Germans | 61.6 /100 | #166 | Good $54,974 |
| Immigrants | Fiji | 61.2 /100 | #167 | Good $54,958 |
| Immigrants | Vietnam | 60.2 /100 | #168 | Good $54,913 |
| French Canadians | 55.6 /100 | #169 | Average $54,722 |
| Finns | 55.6 /100 | #170 | Average $54,721 |
| Immigrants | Peru | 54.9 /100 | #171 | Average $54,695 |
| Welsh | 53.8 /100 | #172 | Average $54,647 |