Polish vs Immigrants from Philippines Householder Income Under 25 years
COMPARE
Polish
Immigrants from Philippines
Householder Income Under 25 years
Householder Income Under 25 years Comparison
Poles
Immigrants from Philippines
$52,407
HOUSEHOLDER INCOME UNDER 25 YEARS
63.0/ 100
METRIC RATING
165th/ 347
METRIC RANK
$57,930
HOUSEHOLDER INCOME UNDER 25 YEARS
100.0/ 100
METRIC RATING
12th/ 347
METRIC RANK
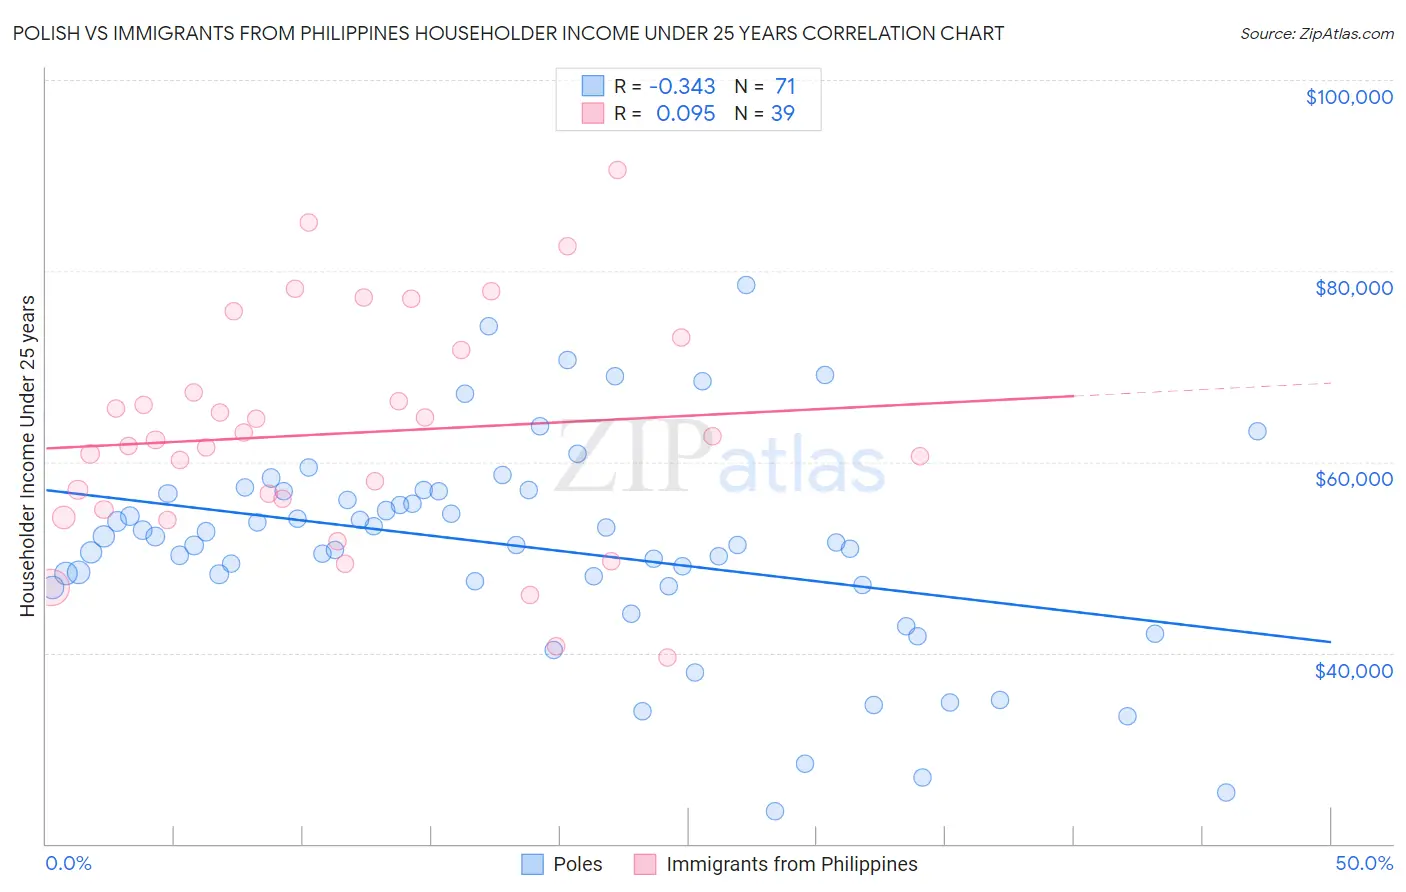
Polish vs Immigrants from Philippines Householder Income Under 25 years Correlation Chart
The statistical analysis conducted on geographies consisting of 433,901,695 people shows a mild negative correlation between the proportion of Poles and household income with householder under the age of 25 in the United States with a correlation coefficient (R) of -0.343 and weighted average of $52,407. Similarly, the statistical analysis conducted on geographies consisting of 387,978,283 people shows a slight positive correlation between the proportion of Immigrants from Philippines and household income with householder under the age of 25 in the United States with a correlation coefficient (R) of 0.095 and weighted average of $57,930, a difference of 10.5%.
Householder Income Under 25 years Correlation Summary
| Measurement | Polish | Immigrants from Philippines |
| Minimum | $23,462 | $39,563 |
| Maximum | $78,571 | $90,625 |
| Range | $55,109 | $51,062 |
| Mean | $51,111 | $62,967 |
| Median | $51,592 | $62,302 |
| Interquartile 25% (IQ1) | $47,153 | $54,996 |
| Interquartile 75% (IQ3) | $56,895 | $71,754 |
| Interquartile Range (IQR) | $9,742 | $16,758 |
| Standard Deviation (Sample) | $10,979 | $11,887 |
| Standard Deviation (Population) | $10,902 | $11,733 |
Similar Demographics by Householder Income Under 25 years
Demographics Similar to Poles by Householder Income Under 25 years
In terms of householder income under 25 years, the demographic groups most similar to Poles are Immigrants from Austria ($52,400, a difference of 0.010%), Immigrants from Chile ($52,440, a difference of 0.060%), Immigrants from Trinidad and Tobago ($52,437, a difference of 0.060%), Immigrants from Uganda ($52,374, a difference of 0.060%), and Immigrants from Cambodia ($52,450, a difference of 0.080%).
| Demographics | Rating | Rank | Householder Income Under 25 years |
| Immigrants | Netherlands | 72.8 /100 | #158 | Good $52,592 |
| Mongolians | 70.2 /100 | #159 | Good $52,540 |
| Immigrants | Turkey | 68.3 /100 | #160 | Good $52,503 |
| Uruguayans | 66.2 /100 | #161 | Good $52,465 |
| Immigrants | Cambodia | 65.4 /100 | #162 | Good $52,450 |
| Immigrants | Chile | 64.8 /100 | #163 | Good $52,440 |
| Immigrants | Trinidad and Tobago | 64.7 /100 | #164 | Good $52,437 |
| Poles | 63.0 /100 | #165 | Good $52,407 |
| Immigrants | Austria | 62.6 /100 | #166 | Good $52,400 |
| Immigrants | Uganda | 61.1 /100 | #167 | Good $52,374 |
| Japanese | 60.5 /100 | #168 | Good $52,365 |
| Canadians | 58.8 /100 | #169 | Average $52,336 |
| Israelis | 58.8 /100 | #170 | Average $52,335 |
| Immigrants | Uruguay | 56.8 /100 | #171 | Average $52,302 |
| Cypriots | 51.2 /100 | #172 | Average $52,209 |
Demographics Similar to Immigrants from Philippines by Householder Income Under 25 years
In terms of householder income under 25 years, the demographic groups most similar to Immigrants from Philippines are Immigrants from China ($57,931, a difference of 0.0%), Afghan ($58,019, a difference of 0.15%), Immigrants from South Central Asia ($57,818, a difference of 0.19%), Filipino ($57,740, a difference of 0.33%), and Korean ($57,730, a difference of 0.35%).
| Demographics | Rating | Rank | Householder Income Under 25 years |
| Immigrants | Bolivia | 100.0 /100 | #5 | Exceptional $59,389 |
| Thais | 100.0 /100 | #6 | Exceptional $59,187 |
| Bolivians | 100.0 /100 | #7 | Exceptional $58,506 |
| Indians (Asian) | 100.0 /100 | #8 | Exceptional $58,239 |
| Chinese | 100.0 /100 | #9 | Exceptional $58,162 |
| Afghans | 100.0 /100 | #10 | Exceptional $58,019 |
| Immigrants | China | 100.0 /100 | #11 | Exceptional $57,931 |
| Immigrants | Philippines | 100.0 /100 | #12 | Exceptional $57,930 |
| Immigrants | South Central Asia | 100.0 /100 | #13 | Exceptional $57,818 |
| Filipinos | 100.0 /100 | #14 | Exceptional $57,740 |
| Koreans | 100.0 /100 | #15 | Exceptional $57,730 |
| Immigrants | Afghanistan | 100.0 /100 | #16 | Exceptional $57,478 |
| Sierra Leoneans | 100.0 /100 | #17 | Exceptional $57,272 |
| Immigrants | Eastern Asia | 100.0 /100 | #18 | Exceptional $57,123 |
| Bhutanese | 100.0 /100 | #19 | Exceptional $57,078 |