Polish vs Alaskan Athabascan Median Family Income
COMPARE
Polish
Alaskan Athabascan
Median Family Income
Median Family Income Comparison
Poles
Alaskan Athabascans
$108,507
MEDIAN FAMILY INCOME
95.2/ 100
METRIC RATING
114th/ 347
METRIC RANK
$94,429
MEDIAN FAMILY INCOME
1.5/ 100
METRIC RATING
237th/ 347
METRIC RANK
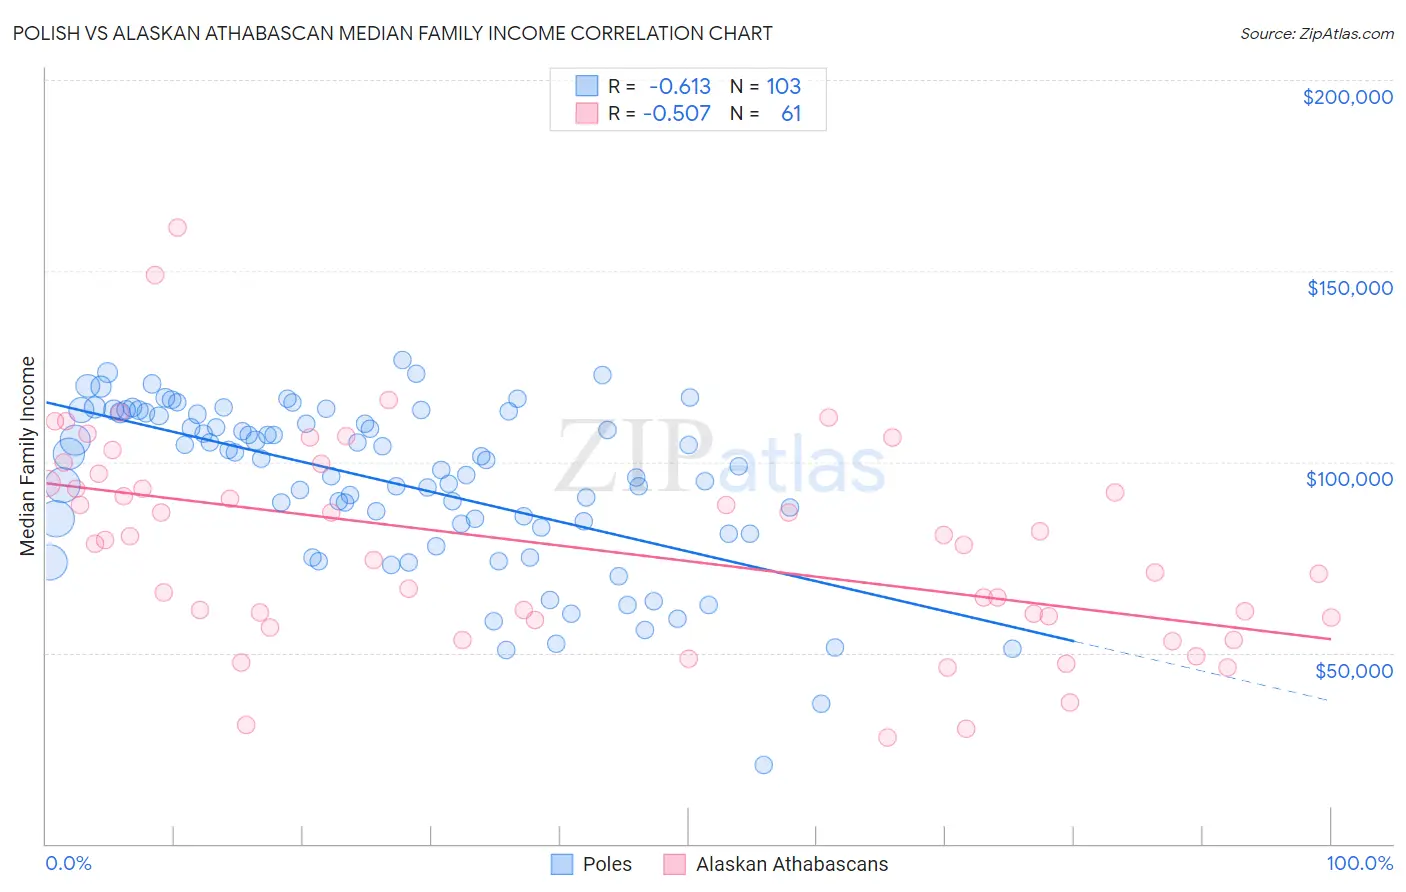
Polish vs Alaskan Athabascan Median Family Income Correlation Chart
The statistical analysis conducted on geographies consisting of 559,354,572 people shows a significant negative correlation between the proportion of Poles and median family income in the United States with a correlation coefficient (R) of -0.613 and weighted average of $108,507. Similarly, the statistical analysis conducted on geographies consisting of 45,809,380 people shows a substantial negative correlation between the proportion of Alaskan Athabascans and median family income in the United States with a correlation coefficient (R) of -0.507 and weighted average of $94,429, a difference of 14.9%.
Median Family Income Correlation Summary
| Measurement | Polish | Alaskan Athabascan |
| Minimum | $20,484 | $27,750 |
| Maximum | $126,779 | $161,458 |
| Range | $106,295 | $133,708 |
| Mean | $94,533 | $77,954 |
| Median | $100,344 | $78,665 |
| Interquartile 25% (IQ1) | $82,684 | $58,765 |
| Interquartile 75% (IQ3) | $112,830 | $95,601 |
| Interquartile Range (IQR) | $30,146 | $36,836 |
| Standard Deviation (Sample) | $21,570 | $27,325 |
| Standard Deviation (Population) | $21,465 | $27,100 |
Similar Demographics by Median Family Income
Demographics Similar to Poles by Median Family Income
In terms of median family income, the demographic groups most similar to Poles are Swedish ($108,499, a difference of 0.010%), Immigrants from Saudi Arabia ($108,544, a difference of 0.030%), Immigrants from Poland ($108,570, a difference of 0.060%), Chilean ($108,429, a difference of 0.070%), and Immigrants from Western Asia ($108,691, a difference of 0.17%).
| Demographics | Rating | Rank | Median Family Income |
| Immigrants | North Macedonia | 96.4 /100 | #107 | Exceptional $109,136 |
| Immigrants | Zimbabwe | 95.9 /100 | #108 | Exceptional $108,830 |
| Immigrants | Afghanistan | 95.6 /100 | #109 | Exceptional $108,709 |
| British | 95.6 /100 | #110 | Exceptional $108,705 |
| Immigrants | Western Asia | 95.6 /100 | #111 | Exceptional $108,691 |
| Immigrants | Poland | 95.3 /100 | #112 | Exceptional $108,570 |
| Immigrants | Saudi Arabia | 95.2 /100 | #113 | Exceptional $108,544 |
| Poles | 95.2 /100 | #114 | Exceptional $108,507 |
| Swedes | 95.1 /100 | #115 | Exceptional $108,499 |
| Chileans | 95.0 /100 | #116 | Exceptional $108,429 |
| Immigrants | Philippines | 94.6 /100 | #117 | Exceptional $108,288 |
| Ethiopians | 94.5 /100 | #118 | Exceptional $108,251 |
| Sri Lankans | 94.5 /100 | #119 | Exceptional $108,234 |
| Immigrants | Northern Africa | 94.3 /100 | #120 | Exceptional $108,161 |
| Europeans | 94.1 /100 | #121 | Exceptional $108,099 |
Demographics Similar to Alaskan Athabascans by Median Family Income
In terms of median family income, the demographic groups most similar to Alaskan Athabascans are Immigrants from Burma/Myanmar ($94,472, a difference of 0.040%), Trinidadian and Tobagonian ($94,466, a difference of 0.040%), Immigrants from Western Africa ($94,638, a difference of 0.22%), Immigrants from Bangladesh ($94,665, a difference of 0.25%), and Nepalese ($94,153, a difference of 0.29%).
| Demographics | Rating | Rank | Median Family Income |
| Malaysians | 2.2 /100 | #230 | Tragic $95,230 |
| Ecuadorians | 2.1 /100 | #231 | Tragic $95,114 |
| Immigrants | Venezuela | 1.9 /100 | #232 | Tragic $94,904 |
| Immigrants | Bangladesh | 1.6 /100 | #233 | Tragic $94,665 |
| Immigrants | Western Africa | 1.6 /100 | #234 | Tragic $94,638 |
| Immigrants | Burma/Myanmar | 1.5 /100 | #235 | Tragic $94,472 |
| Trinidadians and Tobagonians | 1.5 /100 | #236 | Tragic $94,466 |
| Alaskan Athabascans | 1.5 /100 | #237 | Tragic $94,429 |
| Nepalese | 1.3 /100 | #238 | Tragic $94,153 |
| Salvadorans | 1.2 /100 | #239 | Tragic $94,109 |
| Somalis | 1.2 /100 | #240 | Tragic $94,085 |
| Immigrants | Trinidad and Tobago | 1.2 /100 | #241 | Tragic $93,988 |
| Barbadians | 1.1 /100 | #242 | Tragic $93,919 |
| German Russians | 1.1 /100 | #243 | Tragic $93,858 |
| Sub-Saharan Africans | 1.0 /100 | #244 | Tragic $93,748 |