Polish vs Sioux Median Family Income
COMPARE
Polish
Sioux
Median Family Income
Median Family Income Comparison
Poles
Sioux
$108,507
MEDIAN FAMILY INCOME
95.2/ 100
METRIC RATING
114th/ 347
METRIC RANK
$82,386
MEDIAN FAMILY INCOME
0.0/ 100
METRIC RATING
325th/ 347
METRIC RANK
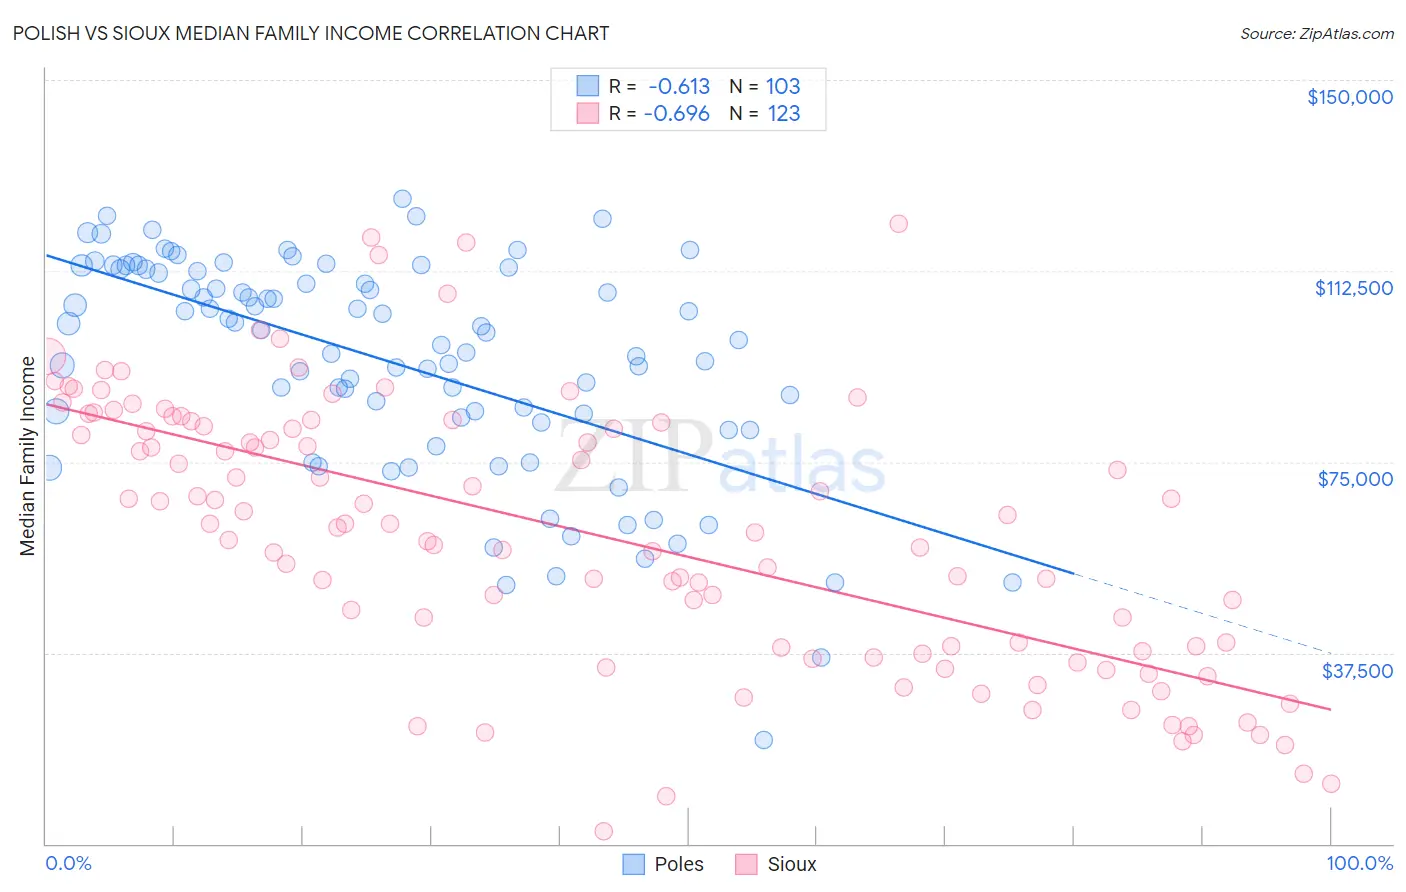
Polish vs Sioux Median Family Income Correlation Chart
The statistical analysis conducted on geographies consisting of 559,354,572 people shows a significant negative correlation between the proportion of Poles and median family income in the United States with a correlation coefficient (R) of -0.613 and weighted average of $108,507. Similarly, the statistical analysis conducted on geographies consisting of 234,054,236 people shows a significant negative correlation between the proportion of Sioux and median family income in the United States with a correlation coefficient (R) of -0.696 and weighted average of $82,386, a difference of 31.7%.
Median Family Income Correlation Summary
| Measurement | Polish | Sioux |
| Minimum | $20,484 | $2,499 |
| Maximum | $126,779 | $121,875 |
| Range | $106,295 | $119,376 |
| Mean | $94,533 | $60,906 |
| Median | $100,344 | $62,832 |
| Interquartile 25% (IQ1) | $82,684 | $37,821 |
| Interquartile 75% (IQ3) | $112,830 | $82,841 |
| Interquartile Range (IQR) | $30,146 | $45,020 |
| Standard Deviation (Sample) | $21,570 | $26,471 |
| Standard Deviation (Population) | $21,465 | $26,363 |
Similar Demographics by Median Family Income
Demographics Similar to Poles by Median Family Income
In terms of median family income, the demographic groups most similar to Poles are Swedish ($108,499, a difference of 0.010%), Immigrants from Saudi Arabia ($108,544, a difference of 0.030%), Immigrants from Poland ($108,570, a difference of 0.060%), Chilean ($108,429, a difference of 0.070%), and Immigrants from Western Asia ($108,691, a difference of 0.17%).
| Demographics | Rating | Rank | Median Family Income |
| Immigrants | North Macedonia | 96.4 /100 | #107 | Exceptional $109,136 |
| Immigrants | Zimbabwe | 95.9 /100 | #108 | Exceptional $108,830 |
| Immigrants | Afghanistan | 95.6 /100 | #109 | Exceptional $108,709 |
| British | 95.6 /100 | #110 | Exceptional $108,705 |
| Immigrants | Western Asia | 95.6 /100 | #111 | Exceptional $108,691 |
| Immigrants | Poland | 95.3 /100 | #112 | Exceptional $108,570 |
| Immigrants | Saudi Arabia | 95.2 /100 | #113 | Exceptional $108,544 |
| Poles | 95.2 /100 | #114 | Exceptional $108,507 |
| Swedes | 95.1 /100 | #115 | Exceptional $108,499 |
| Chileans | 95.0 /100 | #116 | Exceptional $108,429 |
| Immigrants | Philippines | 94.6 /100 | #117 | Exceptional $108,288 |
| Ethiopians | 94.5 /100 | #118 | Exceptional $108,251 |
| Sri Lankans | 94.5 /100 | #119 | Exceptional $108,234 |
| Immigrants | Northern Africa | 94.3 /100 | #120 | Exceptional $108,161 |
| Europeans | 94.1 /100 | #121 | Exceptional $108,099 |
Demographics Similar to Sioux by Median Family Income
In terms of median family income, the demographic groups most similar to Sioux are Creek ($82,560, a difference of 0.21%), Immigrants from Congo ($82,216, a difference of 0.21%), Bahamian ($82,631, a difference of 0.30%), Arapaho ($82,064, a difference of 0.39%), and Black/African American ($81,912, a difference of 0.58%).
| Demographics | Rating | Rank | Median Family Income |
| Immigrants | Mexico | 0.0 /100 | #318 | Tragic $83,639 |
| Immigrants | Honduras | 0.0 /100 | #319 | Tragic $83,618 |
| Seminole | 0.0 /100 | #320 | Tragic $83,354 |
| Immigrants | Caribbean | 0.0 /100 | #321 | Tragic $83,319 |
| Dominicans | 0.0 /100 | #322 | Tragic $82,888 |
| Bahamians | 0.0 /100 | #323 | Tragic $82,631 |
| Creek | 0.0 /100 | #324 | Tragic $82,560 |
| Sioux | 0.0 /100 | #325 | Tragic $82,386 |
| Immigrants | Congo | 0.0 /100 | #326 | Tragic $82,216 |
| Arapaho | 0.0 /100 | #327 | Tragic $82,064 |
| Blacks/African Americans | 0.0 /100 | #328 | Tragic $81,912 |
| Dutch West Indians | 0.0 /100 | #329 | Tragic $81,852 |
| Cheyenne | 0.0 /100 | #330 | Tragic $81,385 |
| Immigrants | Dominican Republic | 0.0 /100 | #331 | Tragic $81,233 |
| Natives/Alaskans | 0.0 /100 | #332 | Tragic $80,908 |