Peruvian vs Alaskan Athabascan Median Family Income
COMPARE
Peruvian
Alaskan Athabascan
Median Family Income
Median Family Income Comparison
Peruvians
Alaskan Athabascans
$105,444
MEDIAN FAMILY INCOME
80.4/ 100
METRIC RATING
151st/ 347
METRIC RANK
$94,429
MEDIAN FAMILY INCOME
1.5/ 100
METRIC RATING
237th/ 347
METRIC RANK
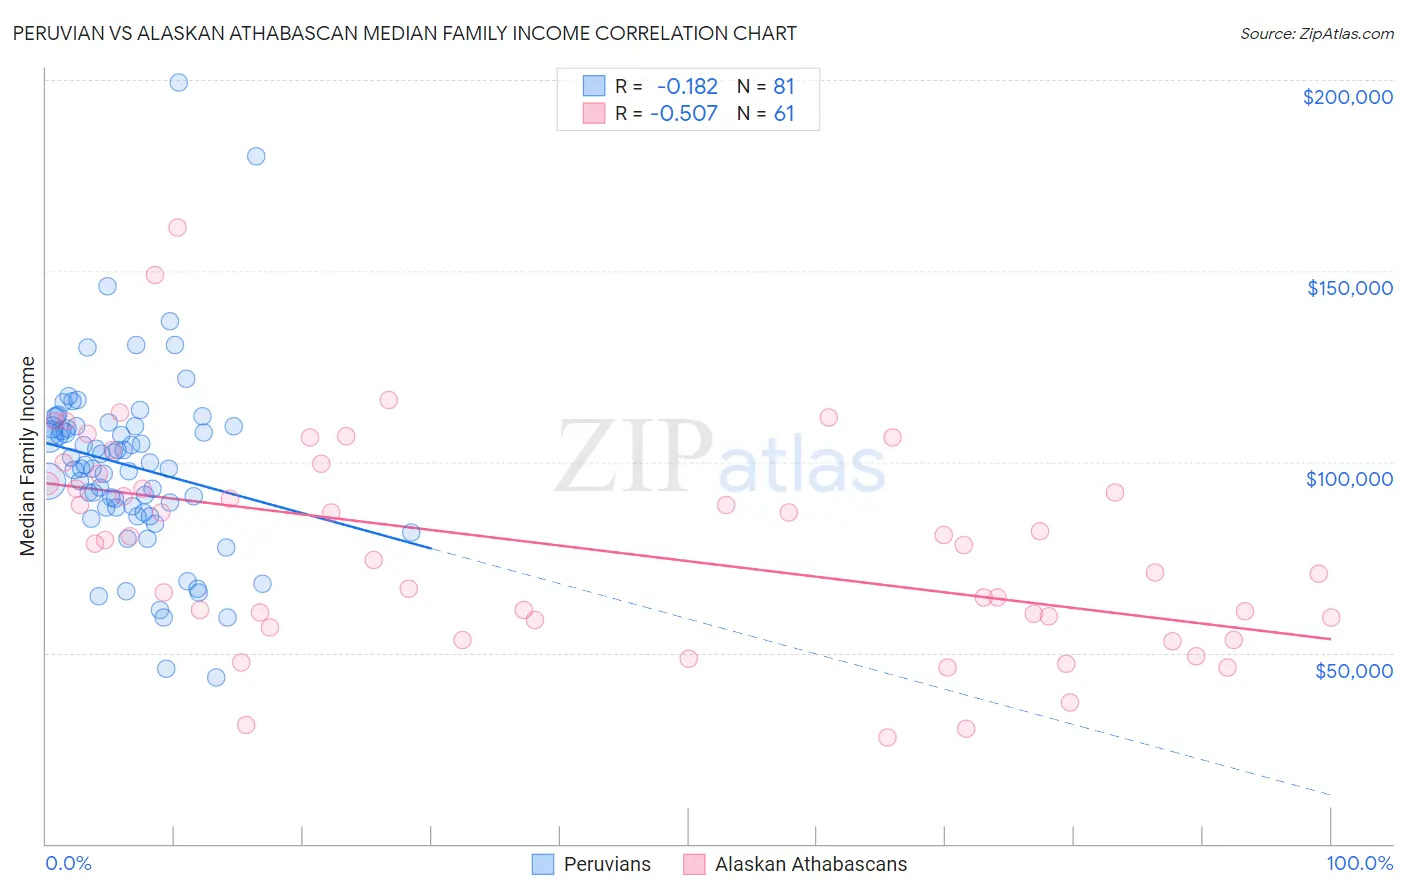
Peruvian vs Alaskan Athabascan Median Family Income Correlation Chart
The statistical analysis conducted on geographies consisting of 362,843,990 people shows a poor negative correlation between the proportion of Peruvians and median family income in the United States with a correlation coefficient (R) of -0.182 and weighted average of $105,444. Similarly, the statistical analysis conducted on geographies consisting of 45,809,380 people shows a substantial negative correlation between the proportion of Alaskan Athabascans and median family income in the United States with a correlation coefficient (R) of -0.507 and weighted average of $94,429, a difference of 11.7%.
Median Family Income Correlation Summary
| Measurement | Peruvian | Alaskan Athabascan |
| Minimum | $43,482 | $27,750 |
| Maximum | $199,297 | $161,458 |
| Range | $155,815 | $133,708 |
| Mean | $98,972 | $77,954 |
| Median | $99,243 | $78,665 |
| Interquartile 25% (IQ1) | $87,340 | $58,765 |
| Interquartile 75% (IQ3) | $109,266 | $95,601 |
| Interquartile Range (IQR) | $21,927 | $36,836 |
| Standard Deviation (Sample) | $24,295 | $27,325 |
| Standard Deviation (Population) | $24,144 | $27,100 |
Similar Demographics by Median Family Income
Demographics Similar to Peruvians by Median Family Income
In terms of median family income, the demographic groups most similar to Peruvians are Irish ($105,453, a difference of 0.010%), Immigrants from Germany ($105,507, a difference of 0.060%), Immigrants from Albania ($105,285, a difference of 0.15%), Hungarian ($105,609, a difference of 0.16%), and Immigrants from Chile ($105,655, a difference of 0.20%).
| Demographics | Rating | Rank | Median Family Income |
| Immigrants | Morocco | 84.3 /100 | #144 | Excellent $105,964 |
| Danes | 83.8 /100 | #145 | Excellent $105,900 |
| Czechs | 83.4 /100 | #146 | Excellent $105,839 |
| Immigrants | Chile | 82.1 /100 | #147 | Excellent $105,655 |
| Hungarians | 81.7 /100 | #148 | Excellent $105,609 |
| Immigrants | Germany | 80.9 /100 | #149 | Excellent $105,507 |
| Irish | 80.5 /100 | #150 | Excellent $105,453 |
| Peruvians | 80.4 /100 | #151 | Excellent $105,444 |
| Immigrants | Albania | 79.1 /100 | #152 | Good $105,285 |
| Slavs | 77.9 /100 | #153 | Good $105,144 |
| Immigrants | Nepal | 76.3 /100 | #154 | Good $104,966 |
| Native Hawaiians | 75.8 /100 | #155 | Good $104,910 |
| Basques | 74.4 /100 | #156 | Good $104,760 |
| Moroccans | 71.6 /100 | #157 | Good $104,488 |
| Scandinavians | 70.8 /100 | #158 | Good $104,410 |
Demographics Similar to Alaskan Athabascans by Median Family Income
In terms of median family income, the demographic groups most similar to Alaskan Athabascans are Immigrants from Burma/Myanmar ($94,472, a difference of 0.040%), Trinidadian and Tobagonian ($94,466, a difference of 0.040%), Immigrants from Western Africa ($94,638, a difference of 0.22%), Immigrants from Bangladesh ($94,665, a difference of 0.25%), and Nepalese ($94,153, a difference of 0.29%).
| Demographics | Rating | Rank | Median Family Income |
| Malaysians | 2.2 /100 | #230 | Tragic $95,230 |
| Ecuadorians | 2.1 /100 | #231 | Tragic $95,114 |
| Immigrants | Venezuela | 1.9 /100 | #232 | Tragic $94,904 |
| Immigrants | Bangladesh | 1.6 /100 | #233 | Tragic $94,665 |
| Immigrants | Western Africa | 1.6 /100 | #234 | Tragic $94,638 |
| Immigrants | Burma/Myanmar | 1.5 /100 | #235 | Tragic $94,472 |
| Trinidadians and Tobagonians | 1.5 /100 | #236 | Tragic $94,466 |
| Alaskan Athabascans | 1.5 /100 | #237 | Tragic $94,429 |
| Nepalese | 1.3 /100 | #238 | Tragic $94,153 |
| Salvadorans | 1.2 /100 | #239 | Tragic $94,109 |
| Somalis | 1.2 /100 | #240 | Tragic $94,085 |
| Immigrants | Trinidad and Tobago | 1.2 /100 | #241 | Tragic $93,988 |
| Barbadians | 1.1 /100 | #242 | Tragic $93,919 |
| German Russians | 1.1 /100 | #243 | Tragic $93,858 |
| Sub-Saharan Africans | 1.0 /100 | #244 | Tragic $93,748 |