Ottawa vs Trinidadian and Tobagonian Per Capita Income
COMPARE
Ottawa
Trinidadian and Tobagonian
Per Capita Income
Per Capita Income Comparison
Ottawa
Trinidadians and Tobagonians
$37,101
PER CAPITA INCOME
0.1/ 100
METRIC RATING
301st/ 347
METRIC RANK
$41,655
PER CAPITA INCOME
9.5/ 100
METRIC RATING
218th/ 347
METRIC RANK
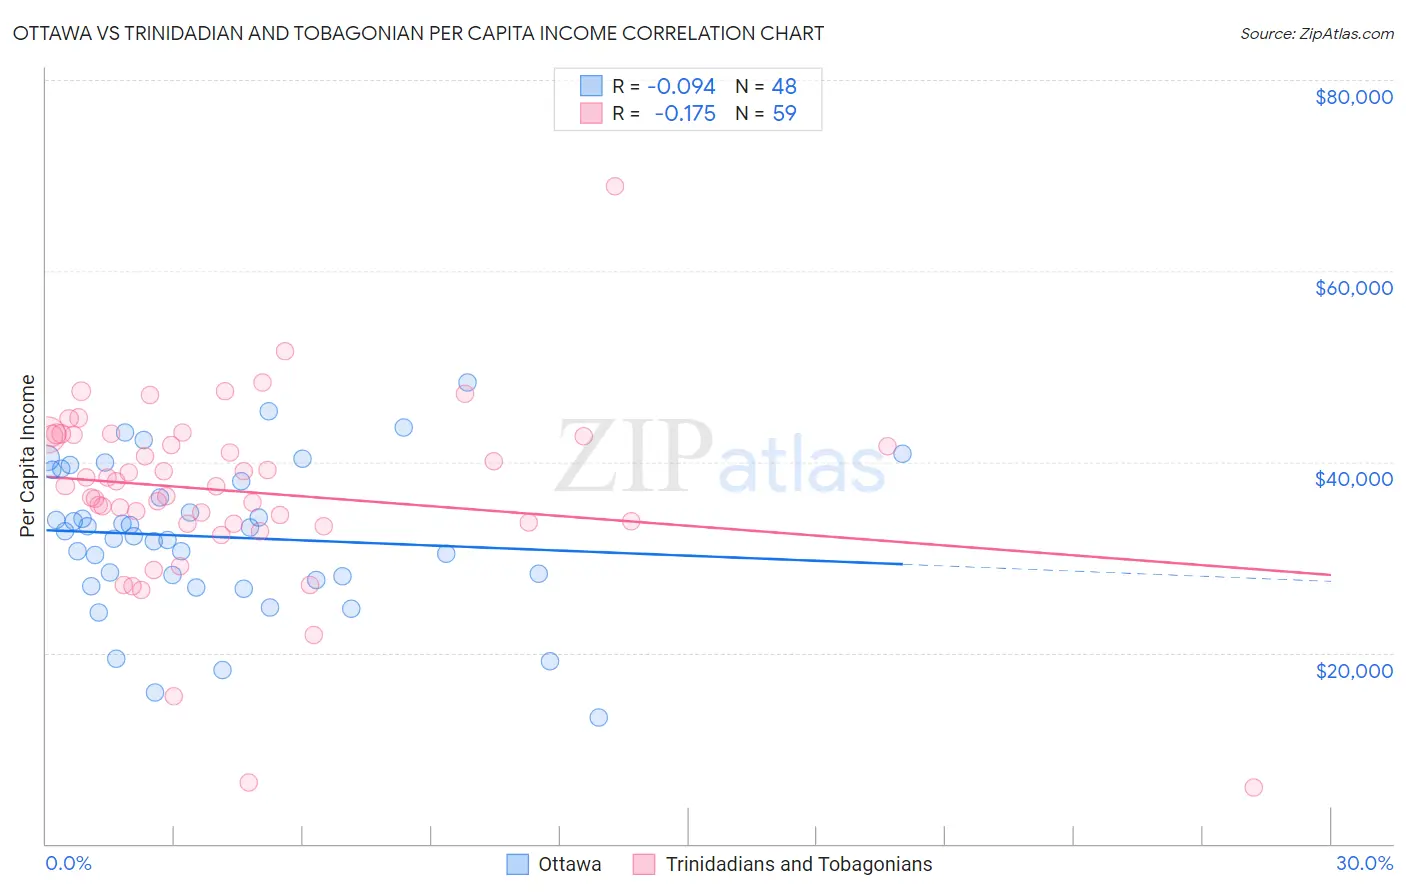
Ottawa vs Trinidadian and Tobagonian Per Capita Income Correlation Chart
The statistical analysis conducted on geographies consisting of 49,956,726 people shows a slight negative correlation between the proportion of Ottawa and per capita income in the United States with a correlation coefficient (R) of -0.094 and weighted average of $37,101. Similarly, the statistical analysis conducted on geographies consisting of 219,889,978 people shows a poor negative correlation between the proportion of Trinidadians and Tobagonians and per capita income in the United States with a correlation coefficient (R) of -0.175 and weighted average of $41,655, a difference of 12.3%.
Per Capita Income Correlation Summary
| Measurement | Ottawa | Trinidadian and Tobagonian |
| Minimum | $13,161 | $5,914 |
| Maximum | $48,274 | $68,888 |
| Range | $35,113 | $62,974 |
| Mean | $32,137 | $36,934 |
| Median | $32,448 | $37,494 |
| Interquartile 25% (IQ1) | $27,814 | $33,546 |
| Interquartile 75% (IQ3) | $38,554 | $42,786 |
| Interquartile Range (IQR) | $10,740 | $9,240 |
| Standard Deviation (Sample) | $7,713 | $9,761 |
| Standard Deviation (Population) | $7,632 | $9,678 |
Similar Demographics by Per Capita Income
Demographics Similar to Ottawa by Per Capita Income
In terms of per capita income, the demographic groups most similar to Ottawa are Shoshone ($37,072, a difference of 0.080%), Paiute ($37,066, a difference of 0.10%), Honduran ($37,031, a difference of 0.19%), Immigrants from Bahamas ($37,193, a difference of 0.25%), and Cherokee ($37,203, a difference of 0.27%).
| Demographics | Rating | Rank | Per Capita Income |
| Cubans | 0.1 /100 | #294 | Tragic $37,383 |
| Immigrants | Dominican Republic | 0.1 /100 | #295 | Tragic $37,306 |
| Indonesians | 0.1 /100 | #296 | Tragic $37,300 |
| Haitians | 0.1 /100 | #297 | Tragic $37,289 |
| Immigrants | Caribbean | 0.1 /100 | #298 | Tragic $37,254 |
| Cherokee | 0.1 /100 | #299 | Tragic $37,203 |
| Immigrants | Bahamas | 0.1 /100 | #300 | Tragic $37,193 |
| Ottawa | 0.1 /100 | #301 | Tragic $37,101 |
| Shoshone | 0.1 /100 | #302 | Tragic $37,072 |
| Paiute | 0.1 /100 | #303 | Tragic $37,066 |
| Hondurans | 0.1 /100 | #304 | Tragic $37,031 |
| Inupiat | 0.1 /100 | #305 | Tragic $36,999 |
| Immigrants | Haiti | 0.0 /100 | #306 | Tragic $36,849 |
| Immigrants | Latin America | 0.0 /100 | #307 | Tragic $36,823 |
| Fijians | 0.0 /100 | #308 | Tragic $36,690 |
Demographics Similar to Trinidadians and Tobagonians by Per Capita Income
In terms of per capita income, the demographic groups most similar to Trinidadians and Tobagonians are Guamanian/Chamorro ($41,678, a difference of 0.060%), Tongan ($41,693, a difference of 0.090%), Sudanese ($41,695, a difference of 0.10%), Immigrants from Bangladesh ($41,709, a difference of 0.13%), and Immigrants from Venezuela ($41,727, a difference of 0.17%).
| Demographics | Rating | Rank | Per Capita Income |
| Immigrants | Panama | 11.6 /100 | #211 | Poor $41,853 |
| Immigrants | Senegal | 11.3 /100 | #212 | Poor $41,830 |
| Immigrants | Venezuela | 10.2 /100 | #213 | Poor $41,727 |
| Immigrants | Bangladesh | 10.1 /100 | #214 | Poor $41,709 |
| Sudanese | 9.9 /100 | #215 | Tragic $41,695 |
| Tongans | 9.9 /100 | #216 | Tragic $41,693 |
| Guamanians/Chamorros | 9.7 /100 | #217 | Tragic $41,678 |
| Trinidadians and Tobagonians | 9.5 /100 | #218 | Tragic $41,655 |
| Puget Sound Salish | 8.1 /100 | #219 | Tragic $41,495 |
| Immigrants | Barbados | 7.9 /100 | #220 | Tragic $41,478 |
| Immigrants | Trinidad and Tobago | 7.9 /100 | #221 | Tragic $41,476 |
| Immigrants | Iraq | 7.1 /100 | #222 | Tragic $41,365 |
| Immigrants | Cameroon | 6.8 /100 | #223 | Tragic $41,334 |
| Immigrants | St. Vincent and the Grenadines | 6.4 /100 | #224 | Tragic $41,270 |
| West Indians | 6.0 /100 | #225 | Tragic $41,217 |