Ottawa vs Swedish Per Capita Income
COMPARE
Ottawa
Swedish
Per Capita Income
Per Capita Income Comparison
Ottawa
Swedes
$37,101
PER CAPITA INCOME
0.1/ 100
METRIC RATING
301st/ 347
METRIC RANK
$45,750
PER CAPITA INCOME
91.3/ 100
METRIC RATING
128th/ 347
METRIC RANK
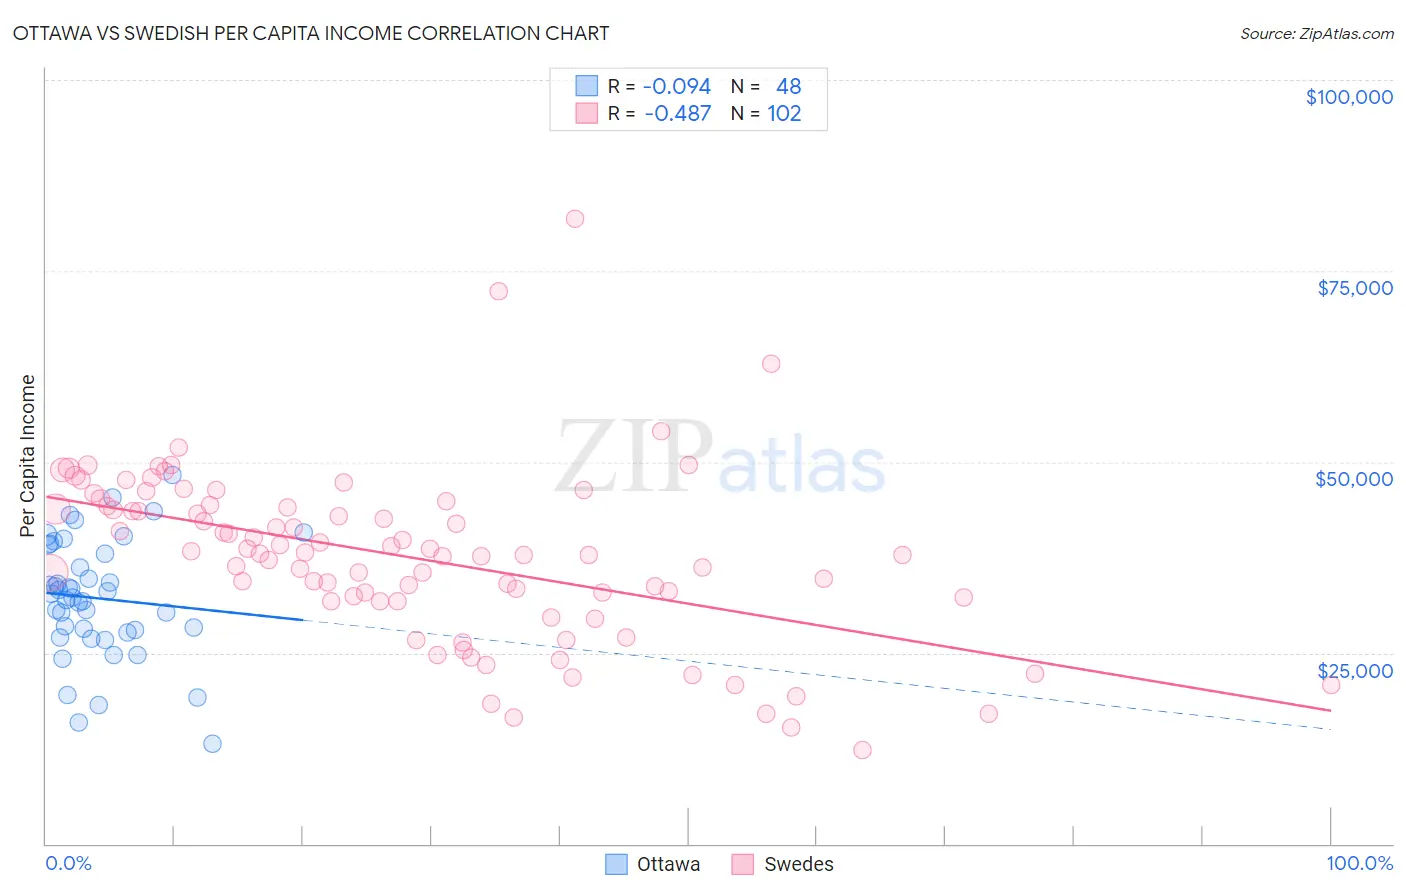
Ottawa vs Swedish Per Capita Income Correlation Chart
The statistical analysis conducted on geographies consisting of 49,956,726 people shows a slight negative correlation between the proportion of Ottawa and per capita income in the United States with a correlation coefficient (R) of -0.094 and weighted average of $37,101. Similarly, the statistical analysis conducted on geographies consisting of 539,281,463 people shows a moderate negative correlation between the proportion of Swedes and per capita income in the United States with a correlation coefficient (R) of -0.487 and weighted average of $45,750, a difference of 23.3%.
Per Capita Income Correlation Summary
| Measurement | Ottawa | Swedish |
| Minimum | $13,161 | $12,332 |
| Maximum | $48,274 | $81,765 |
| Range | $35,113 | $69,433 |
| Mean | $32,137 | $37,501 |
| Median | $32,448 | $37,895 |
| Interquartile 25% (IQ1) | $27,814 | $31,815 |
| Interquartile 75% (IQ3) | $38,554 | $44,149 |
| Interquartile Range (IQR) | $10,740 | $12,334 |
| Standard Deviation (Sample) | $7,713 | $11,325 |
| Standard Deviation (Population) | $7,632 | $11,269 |
Similar Demographics by Per Capita Income
Demographics Similar to Ottawa by Per Capita Income
In terms of per capita income, the demographic groups most similar to Ottawa are Shoshone ($37,072, a difference of 0.080%), Paiute ($37,066, a difference of 0.10%), Honduran ($37,031, a difference of 0.19%), Immigrants from Bahamas ($37,193, a difference of 0.25%), and Cherokee ($37,203, a difference of 0.27%).
| Demographics | Rating | Rank | Per Capita Income |
| Cubans | 0.1 /100 | #294 | Tragic $37,383 |
| Immigrants | Dominican Republic | 0.1 /100 | #295 | Tragic $37,306 |
| Indonesians | 0.1 /100 | #296 | Tragic $37,300 |
| Haitians | 0.1 /100 | #297 | Tragic $37,289 |
| Immigrants | Caribbean | 0.1 /100 | #298 | Tragic $37,254 |
| Cherokee | 0.1 /100 | #299 | Tragic $37,203 |
| Immigrants | Bahamas | 0.1 /100 | #300 | Tragic $37,193 |
| Ottawa | 0.1 /100 | #301 | Tragic $37,101 |
| Shoshone | 0.1 /100 | #302 | Tragic $37,072 |
| Paiute | 0.1 /100 | #303 | Tragic $37,066 |
| Hondurans | 0.1 /100 | #304 | Tragic $37,031 |
| Inupiat | 0.1 /100 | #305 | Tragic $36,999 |
| Immigrants | Haiti | 0.0 /100 | #306 | Tragic $36,849 |
| Immigrants | Latin America | 0.0 /100 | #307 | Tragic $36,823 |
| Fijians | 0.0 /100 | #308 | Tragic $36,690 |
Demographics Similar to Swedes by Per Capita Income
In terms of per capita income, the demographic groups most similar to Swedes are Immigrants from Germany ($45,751, a difference of 0.0%), Palestinian ($45,790, a difference of 0.090%), Zimbabwean ($45,804, a difference of 0.12%), European ($45,836, a difference of 0.19%), and Luxembourger ($45,663, a difference of 0.19%).
| Demographics | Rating | Rank | Per Capita Income |
| Canadians | 92.2 /100 | #121 | Exceptional $45,858 |
| Moroccans | 92.1 /100 | #122 | Exceptional $45,854 |
| Lebanese | 92.0 /100 | #123 | Exceptional $45,840 |
| Europeans | 92.0 /100 | #124 | Exceptional $45,836 |
| Zimbabweans | 91.7 /100 | #125 | Exceptional $45,804 |
| Palestinians | 91.6 /100 | #126 | Exceptional $45,790 |
| Immigrants | Germany | 91.3 /100 | #127 | Exceptional $45,751 |
| Swedes | 91.3 /100 | #128 | Exceptional $45,750 |
| Luxembourgers | 90.4 /100 | #129 | Exceptional $45,663 |
| Arabs | 90.4 /100 | #130 | Exceptional $45,662 |
| Immigrants | North Macedonia | 90.0 /100 | #131 | Exceptional $45,622 |
| Jordanians | 89.9 /100 | #132 | Excellent $45,605 |
| Pakistanis | 89.7 /100 | #133 | Excellent $45,587 |
| Slovenes | 89.6 /100 | #134 | Excellent $45,581 |
| Hungarians | 87.9 /100 | #135 | Excellent $45,426 |