Ottawa vs Laotian Per Capita Income
COMPARE
Ottawa
Laotian
Per Capita Income
Per Capita Income Comparison
Ottawa
Laotians
$37,101
PER CAPITA INCOME
0.1/ 100
METRIC RATING
301st/ 347
METRIC RANK
$47,041
PER CAPITA INCOME
97.8/ 100
METRIC RATING
99th/ 347
METRIC RANK
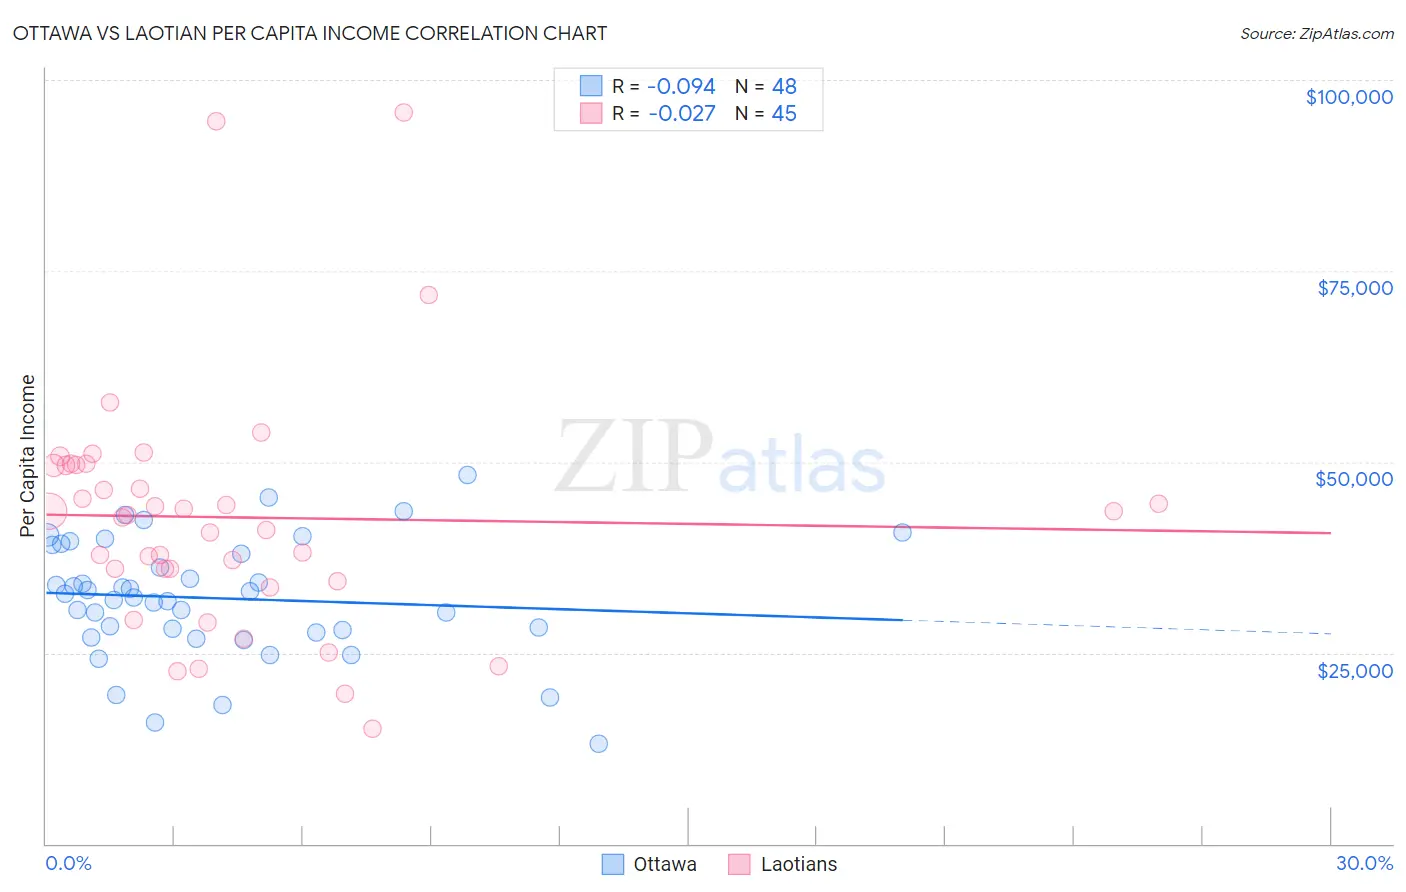
Ottawa vs Laotian Per Capita Income Correlation Chart
The statistical analysis conducted on geographies consisting of 49,956,726 people shows a slight negative correlation between the proportion of Ottawa and per capita income in the United States with a correlation coefficient (R) of -0.094 and weighted average of $37,101. Similarly, the statistical analysis conducted on geographies consisting of 224,867,233 people shows no correlation between the proportion of Laotians and per capita income in the United States with a correlation coefficient (R) of -0.027 and weighted average of $47,041, a difference of 26.8%.
Per Capita Income Correlation Summary
| Measurement | Ottawa | Laotian |
| Minimum | $13,161 | $14,980 |
| Maximum | $48,274 | $95,805 |
| Range | $35,113 | $80,825 |
| Mean | $32,137 | $42,727 |
| Median | $32,448 | $43,043 |
| Interquartile 25% (IQ1) | $27,814 | $35,205 |
| Interquartile 75% (IQ3) | $38,554 | $49,592 |
| Interquartile Range (IQR) | $10,740 | $14,387 |
| Standard Deviation (Sample) | $7,713 | $15,836 |
| Standard Deviation (Population) | $7,632 | $15,659 |
Similar Demographics by Per Capita Income
Demographics Similar to Ottawa by Per Capita Income
In terms of per capita income, the demographic groups most similar to Ottawa are Shoshone ($37,072, a difference of 0.080%), Paiute ($37,066, a difference of 0.10%), Honduran ($37,031, a difference of 0.19%), Immigrants from Bahamas ($37,193, a difference of 0.25%), and Cherokee ($37,203, a difference of 0.27%).
| Demographics | Rating | Rank | Per Capita Income |
| Cubans | 0.1 /100 | #294 | Tragic $37,383 |
| Immigrants | Dominican Republic | 0.1 /100 | #295 | Tragic $37,306 |
| Indonesians | 0.1 /100 | #296 | Tragic $37,300 |
| Haitians | 0.1 /100 | #297 | Tragic $37,289 |
| Immigrants | Caribbean | 0.1 /100 | #298 | Tragic $37,254 |
| Cherokee | 0.1 /100 | #299 | Tragic $37,203 |
| Immigrants | Bahamas | 0.1 /100 | #300 | Tragic $37,193 |
| Ottawa | 0.1 /100 | #301 | Tragic $37,101 |
| Shoshone | 0.1 /100 | #302 | Tragic $37,072 |
| Paiute | 0.1 /100 | #303 | Tragic $37,066 |
| Hondurans | 0.1 /100 | #304 | Tragic $37,031 |
| Inupiat | 0.1 /100 | #305 | Tragic $36,999 |
| Immigrants | Haiti | 0.0 /100 | #306 | Tragic $36,849 |
| Immigrants | Latin America | 0.0 /100 | #307 | Tragic $36,823 |
| Fijians | 0.0 /100 | #308 | Tragic $36,690 |
Demographics Similar to Laotians by Per Capita Income
In terms of per capita income, the demographic groups most similar to Laotians are Immigrants from Pakistan ($47,084, a difference of 0.090%), Immigrants from Lebanon ($46,938, a difference of 0.22%), Immigrants from Uzbekistan ($46,929, a difference of 0.24%), Immigrants from Western Asia ($46,876, a difference of 0.35%), and Syrian ($46,837, a difference of 0.43%).
| Demographics | Rating | Rank | Per Capita Income |
| Immigrants | Moldova | 98.7 /100 | #92 | Exceptional $47,489 |
| Immigrants | Zimbabwe | 98.5 /100 | #93 | Exceptional $47,394 |
| Albanians | 98.5 /100 | #94 | Exceptional $47,379 |
| Immigrants | Egypt | 98.5 /100 | #95 | Exceptional $47,361 |
| Alsatians | 98.3 /100 | #96 | Exceptional $47,284 |
| Carpatho Rusyns | 98.2 /100 | #97 | Exceptional $47,248 |
| Immigrants | Pakistan | 97.9 /100 | #98 | Exceptional $47,084 |
| Laotians | 97.8 /100 | #99 | Exceptional $47,041 |
| Immigrants | Lebanon | 97.5 /100 | #100 | Exceptional $46,938 |
| Immigrants | Uzbekistan | 97.5 /100 | #101 | Exceptional $46,929 |
| Immigrants | Western Asia | 97.4 /100 | #102 | Exceptional $46,876 |
| Syrians | 97.2 /100 | #103 | Exceptional $46,837 |
| Brazilians | 96.8 /100 | #104 | Exceptional $46,700 |
| British | 96.3 /100 | #105 | Exceptional $46,571 |
| Ethiopians | 96.3 /100 | #106 | Exceptional $46,569 |