Ottawa vs Immigrants from Czechoslovakia Median Household Income
COMPARE
Ottawa
Immigrants from Czechoslovakia
Median Household Income
Median Household Income Comparison
Ottawa
Immigrants from Czechoslovakia
$70,984
MEDIAN HOUSEHOLD INCOME
0.0/ 100
METRIC RATING
315th/ 347
METRIC RANK
$95,319
MEDIAN HOUSEHOLD INCOME
99.9/ 100
METRIC RATING
55th/ 347
METRIC RANK
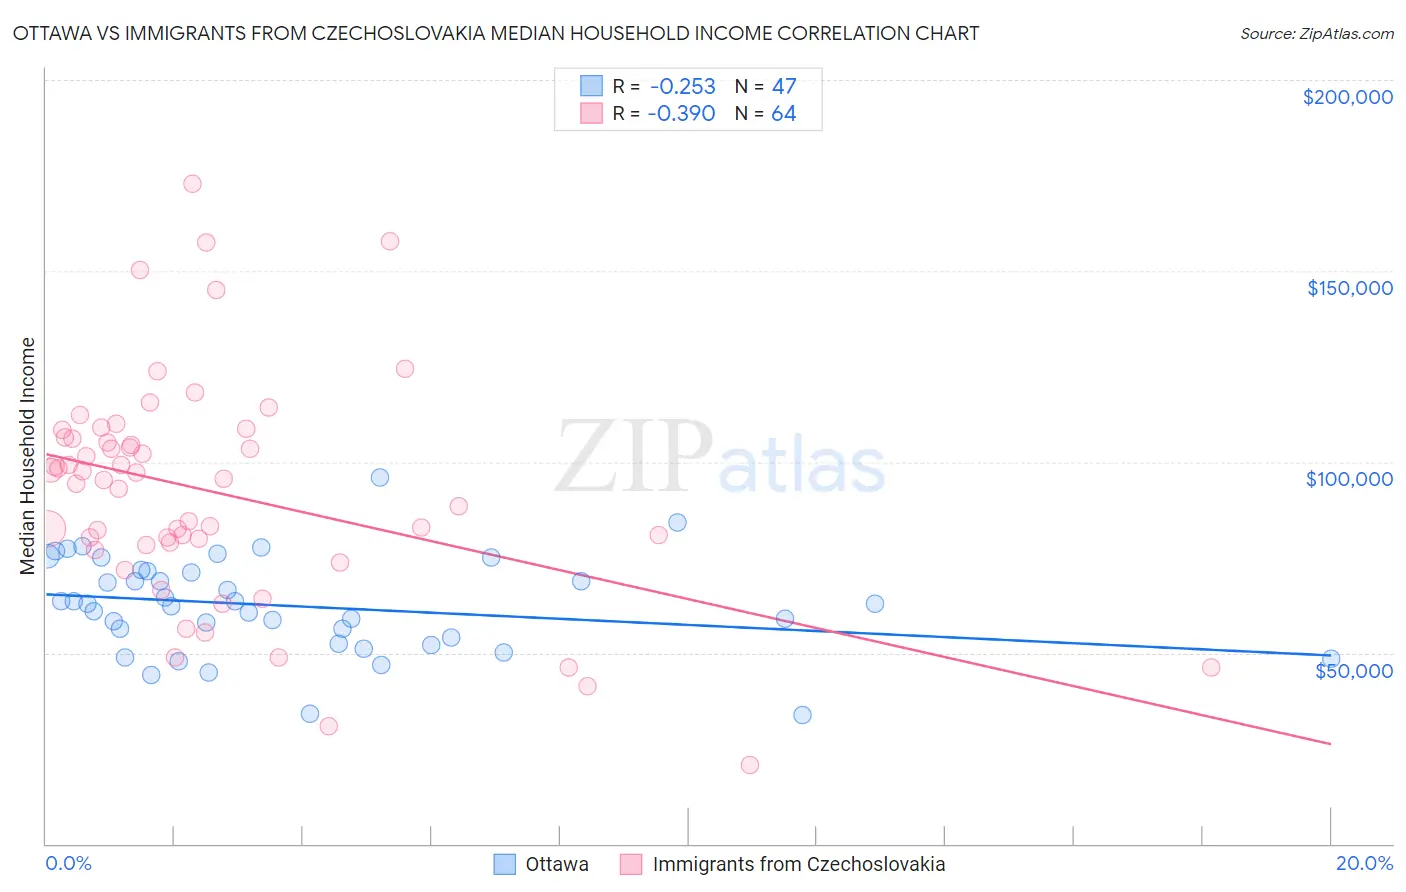
Ottawa vs Immigrants from Czechoslovakia Median Household Income Correlation Chart
The statistical analysis conducted on geographies consisting of 49,944,469 people shows a weak negative correlation between the proportion of Ottawa and median household income in the United States with a correlation coefficient (R) of -0.253 and weighted average of $70,984. Similarly, the statistical analysis conducted on geographies consisting of 195,443,038 people shows a mild negative correlation between the proportion of Immigrants from Czechoslovakia and median household income in the United States with a correlation coefficient (R) of -0.390 and weighted average of $95,319, a difference of 34.3%.
Median Household Income Correlation Summary
| Measurement | Ottawa | Immigrants from Czechoslovakia |
| Minimum | $33,750 | $20,761 |
| Maximum | $95,750 | $172,802 |
| Range | $62,000 | $152,041 |
| Mean | $62,197 | $91,959 |
| Median | $62,810 | $95,339 |
| Interquartile 25% (IQ1) | $52,443 | $78,538 |
| Interquartile 75% (IQ3) | $71,315 | $106,288 |
| Interquartile Range (IQR) | $18,872 | $27,750 |
| Standard Deviation (Sample) | $12,658 | $29,573 |
| Standard Deviation (Population) | $12,523 | $29,341 |
Similar Demographics by Median Household Income
Demographics Similar to Ottawa by Median Household Income
In terms of median household income, the demographic groups most similar to Ottawa are Apache ($70,927, a difference of 0.080%), Dominican ($71,302, a difference of 0.45%), Immigrants from Bahamas ($71,349, a difference of 0.51%), Cajun ($70,605, a difference of 0.54%), and Chippewa ($70,539, a difference of 0.63%).
| Demographics | Rating | Rank | Median Household Income |
| Yakama | 0.0 /100 | #308 | Tragic $72,225 |
| Immigrants | Caribbean | 0.0 /100 | #309 | Tragic $71,860 |
| U.S. Virgin Islanders | 0.0 /100 | #310 | Tragic $71,853 |
| Immigrants | Zaire | 0.0 /100 | #311 | Tragic $71,801 |
| Immigrants | Honduras | 0.0 /100 | #312 | Tragic $71,452 |
| Immigrants | Bahamas | 0.0 /100 | #313 | Tragic $71,349 |
| Dominicans | 0.0 /100 | #314 | Tragic $71,302 |
| Ottawa | 0.0 /100 | #315 | Tragic $70,984 |
| Apache | 0.0 /100 | #316 | Tragic $70,927 |
| Cajuns | 0.0 /100 | #317 | Tragic $70,605 |
| Chippewa | 0.0 /100 | #318 | Tragic $70,539 |
| Immigrants | Dominican Republic | 0.0 /100 | #319 | Tragic $70,208 |
| Colville | 0.0 /100 | #320 | Tragic $70,094 |
| Chickasaw | 0.0 /100 | #321 | Tragic $70,005 |
| Choctaw | 0.0 /100 | #322 | Tragic $69,947 |
Demographics Similar to Immigrants from Czechoslovakia by Median Household Income
In terms of median household income, the demographic groups most similar to Immigrants from Czechoslovakia are Immigrants from Austria ($95,277, a difference of 0.040%), New Zealander ($95,146, a difference of 0.18%), Soviet Union ($95,098, a difference of 0.23%), Immigrants from Europe ($95,032, a difference of 0.30%), and Korean ($95,018, a difference of 0.32%).
| Demographics | Rating | Rank | Median Household Income |
| Cambodians | 99.9 /100 | #48 | Exceptional $96,324 |
| Immigrants | Malaysia | 99.9 /100 | #49 | Exceptional $96,292 |
| Bulgarians | 99.9 /100 | #50 | Exceptional $96,290 |
| Estonians | 99.9 /100 | #51 | Exceptional $95,930 |
| Immigrants | South Africa | 99.9 /100 | #52 | Exceptional $95,800 |
| Paraguayans | 99.9 /100 | #53 | Exceptional $95,737 |
| Egyptians | 99.9 /100 | #54 | Exceptional $95,673 |
| Immigrants | Czechoslovakia | 99.9 /100 | #55 | Exceptional $95,319 |
| Immigrants | Austria | 99.9 /100 | #56 | Exceptional $95,277 |
| New Zealanders | 99.8 /100 | #57 | Exceptional $95,146 |
| Soviet Union | 99.8 /100 | #58 | Exceptional $95,098 |
| Immigrants | Europe | 99.8 /100 | #59 | Exceptional $95,032 |
| Koreans | 99.8 /100 | #60 | Exceptional $95,018 |
| Laotians | 99.8 /100 | #61 | Exceptional $94,990 |
| Immigrants | Norway | 99.8 /100 | #62 | Exceptional $94,846 |