Jordanian vs Immigrants from Czechoslovakia Median Household Income
COMPARE
Jordanian
Immigrants from Czechoslovakia
Median Household Income
Median Household Income Comparison
Jordanians
Immigrants from Czechoslovakia
$91,794
MEDIAN HOUSEHOLD INCOME
98.7/ 100
METRIC RATING
96th/ 347
METRIC RANK
$95,319
MEDIAN HOUSEHOLD INCOME
99.9/ 100
METRIC RATING
55th/ 347
METRIC RANK
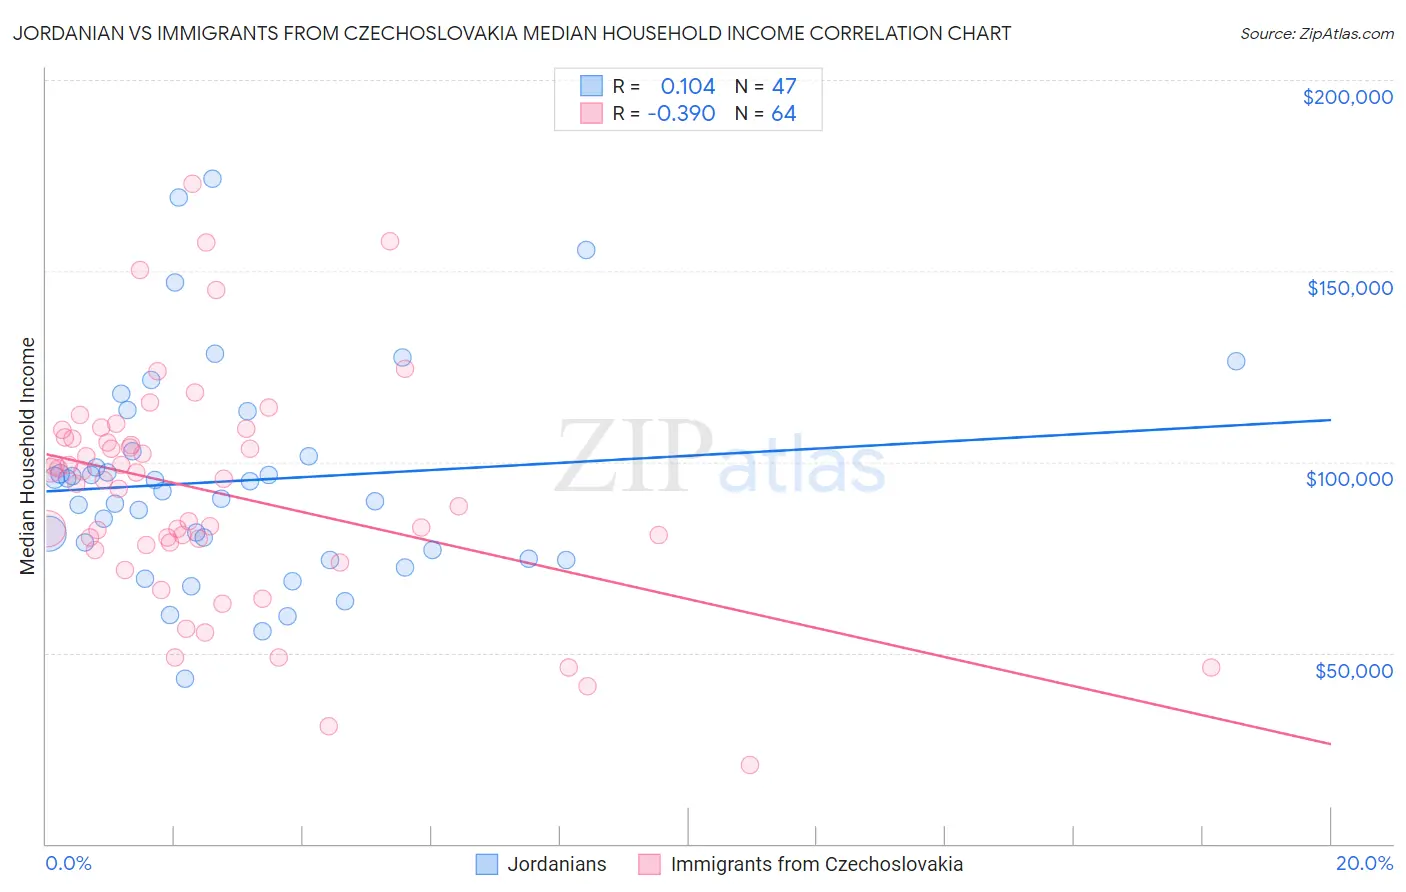
Jordanian vs Immigrants from Czechoslovakia Median Household Income Correlation Chart
The statistical analysis conducted on geographies consisting of 166,374,087 people shows a poor positive correlation between the proportion of Jordanians and median household income in the United States with a correlation coefficient (R) of 0.104 and weighted average of $91,794. Similarly, the statistical analysis conducted on geographies consisting of 195,443,038 people shows a mild negative correlation between the proportion of Immigrants from Czechoslovakia and median household income in the United States with a correlation coefficient (R) of -0.390 and weighted average of $95,319, a difference of 3.8%.
Median Household Income Correlation Summary
| Measurement | Jordanian | Immigrants from Czechoslovakia |
| Minimum | $43,214 | $20,761 |
| Maximum | $174,260 | $172,802 |
| Range | $131,046 | $152,041 |
| Mean | $95,049 | $91,959 |
| Median | $92,429 | $95,339 |
| Interquartile 25% (IQ1) | $74,643 | $78,538 |
| Interquartile 75% (IQ3) | $102,895 | $106,288 |
| Interquartile Range (IQR) | $28,252 | $27,750 |
| Standard Deviation (Sample) | $28,123 | $29,573 |
| Standard Deviation (Population) | $27,822 | $29,341 |
Similar Demographics by Median Household Income
Demographics Similar to Jordanians by Median Household Income
In terms of median household income, the demographic groups most similar to Jordanians are Armenian ($91,807, a difference of 0.010%), Immigrants from North America ($91,860, a difference of 0.070%), Immigrants from Serbia ($91,730, a difference of 0.070%), Immigrants from Lebanon ($91,887, a difference of 0.10%), and Immigrants from Western Europe ($91,936, a difference of 0.15%).
| Demographics | Rating | Rank | Median Household Income |
| Romanians | 98.8 /100 | #89 | Exceptional $91,994 |
| Assyrians/Chaldeans/Syriacs | 98.8 /100 | #90 | Exceptional $91,991 |
| Immigrants | Vietnam | 98.8 /100 | #91 | Exceptional $91,987 |
| Immigrants | Western Europe | 98.8 /100 | #92 | Exceptional $91,936 |
| Immigrants | Lebanon | 98.7 /100 | #93 | Exceptional $91,887 |
| Immigrants | North America | 98.7 /100 | #94 | Exceptional $91,860 |
| Armenians | 98.7 /100 | #95 | Exceptional $91,807 |
| Jordanians | 98.7 /100 | #96 | Exceptional $91,794 |
| Immigrants | Serbia | 98.6 /100 | #97 | Exceptional $91,730 |
| Immigrants | Southern Europe | 98.5 /100 | #98 | Exceptional $91,605 |
| Immigrants | South Eastern Asia | 98.4 /100 | #99 | Exceptional $91,541 |
| Ukrainians | 98.3 /100 | #100 | Exceptional $91,456 |
| Immigrants | Moldova | 98.3 /100 | #101 | Exceptional $91,446 |
| Austrians | 98.2 /100 | #102 | Exceptional $91,339 |
| Immigrants | Ukraine | 98.0 /100 | #103 | Exceptional $91,124 |
Demographics Similar to Immigrants from Czechoslovakia by Median Household Income
In terms of median household income, the demographic groups most similar to Immigrants from Czechoslovakia are Immigrants from Austria ($95,277, a difference of 0.040%), New Zealander ($95,146, a difference of 0.18%), Soviet Union ($95,098, a difference of 0.23%), Immigrants from Europe ($95,032, a difference of 0.30%), and Korean ($95,018, a difference of 0.32%).
| Demographics | Rating | Rank | Median Household Income |
| Cambodians | 99.9 /100 | #48 | Exceptional $96,324 |
| Immigrants | Malaysia | 99.9 /100 | #49 | Exceptional $96,292 |
| Bulgarians | 99.9 /100 | #50 | Exceptional $96,290 |
| Estonians | 99.9 /100 | #51 | Exceptional $95,930 |
| Immigrants | South Africa | 99.9 /100 | #52 | Exceptional $95,800 |
| Paraguayans | 99.9 /100 | #53 | Exceptional $95,737 |
| Egyptians | 99.9 /100 | #54 | Exceptional $95,673 |
| Immigrants | Czechoslovakia | 99.9 /100 | #55 | Exceptional $95,319 |
| Immigrants | Austria | 99.9 /100 | #56 | Exceptional $95,277 |
| New Zealanders | 99.8 /100 | #57 | Exceptional $95,146 |
| Soviet Union | 99.8 /100 | #58 | Exceptional $95,098 |
| Immigrants | Europe | 99.8 /100 | #59 | Exceptional $95,032 |
| Koreans | 99.8 /100 | #60 | Exceptional $95,018 |
| Laotians | 99.8 /100 | #61 | Exceptional $94,990 |
| Immigrants | Norway | 99.8 /100 | #62 | Exceptional $94,846 |