Nonimmigrants vs New Zealander Median Family Income
COMPARE
Nonimmigrants
New Zealander
Median Family Income
Median Family Income Comparison
Nonimmigrants
New Zealanders
$96,231
MEDIAN FAMILY INCOME
3.6/ 100
METRIC RATING
224th/ 347
METRIC RANK
$115,230
MEDIAN FAMILY INCOME
99.8/ 100
METRIC RATING
56th/ 347
METRIC RANK
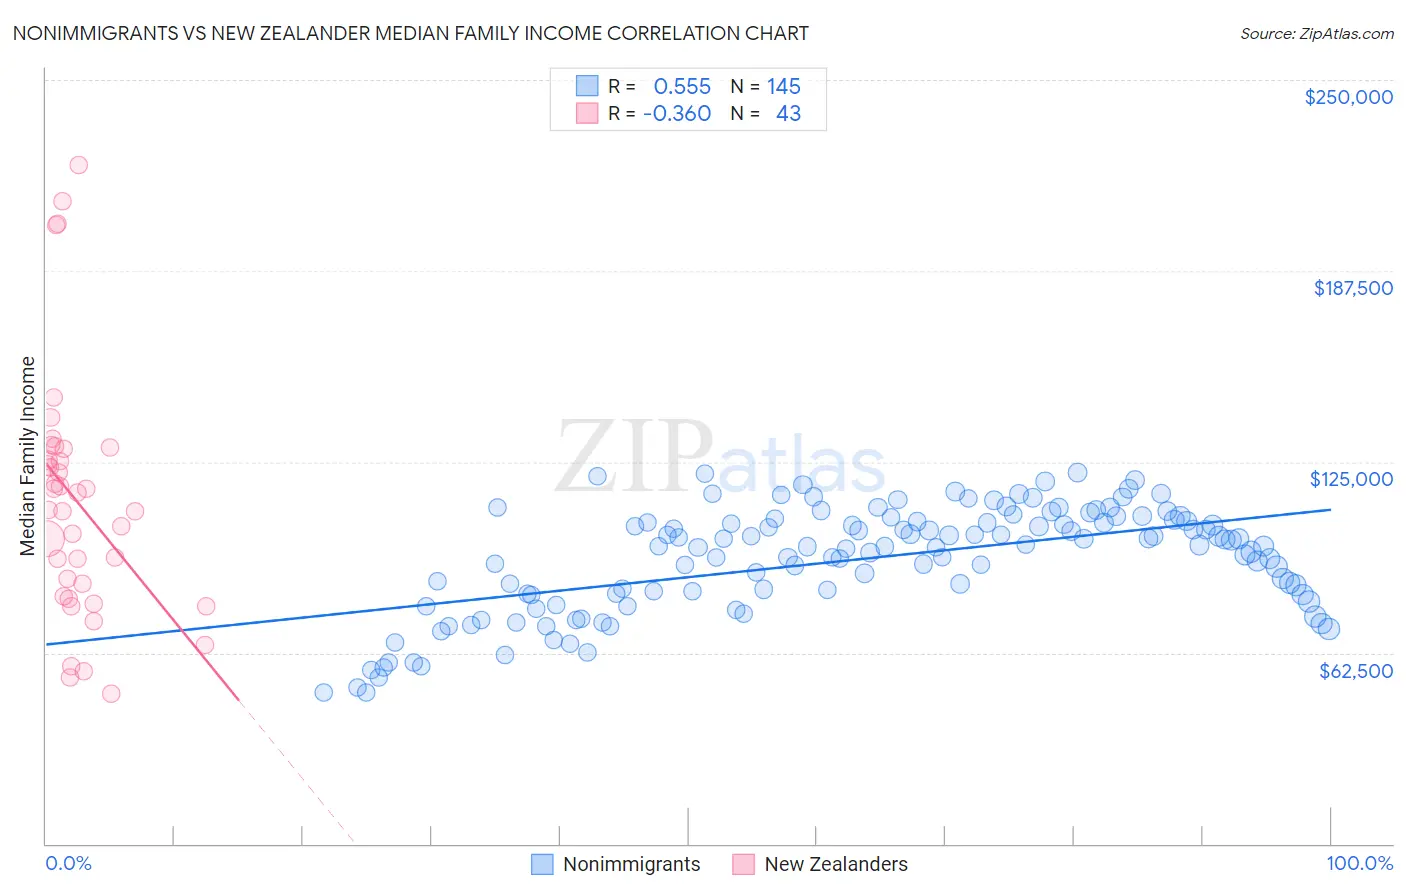
Nonimmigrants vs New Zealander Median Family Income Correlation Chart
The statistical analysis conducted on geographies consisting of 582,429,666 people shows a substantial positive correlation between the proportion of Nonimmigrants and median family income in the United States with a correlation coefficient (R) of 0.555 and weighted average of $96,231. Similarly, the statistical analysis conducted on geographies consisting of 106,887,889 people shows a mild negative correlation between the proportion of New Zealanders and median family income in the United States with a correlation coefficient (R) of -0.360 and weighted average of $115,230, a difference of 19.7%.
Median Family Income Correlation Summary
| Measurement | Nonimmigrants | New Zealander |
| Minimum | $49,547 | $49,107 |
| Maximum | $121,513 | $222,283 |
| Range | $71,966 | $173,176 |
| Mean | $93,127 | $111,963 |
| Median | $97,277 | $109,262 |
| Interquartile 25% (IQ1) | $81,657 | $80,824 |
| Interquartile 75% (IQ3) | $105,547 | $129,386 |
| Interquartile Range (IQR) | $23,890 | $48,562 |
| Standard Deviation (Sample) | $17,276 | $40,212 |
| Standard Deviation (Population) | $17,216 | $39,742 |
Similar Demographics by Median Family Income
Demographics Similar to Nonimmigrants by Median Family Income
In terms of median family income, the demographic groups most similar to Nonimmigrants are Venezuelan ($96,281, a difference of 0.050%), Vietnamese ($96,123, a difference of 0.11%), Immigrants from Nigeria ($96,439, a difference of 0.22%), Immigrants from Ghana ($96,544, a difference of 0.33%), and Sudanese ($96,783, a difference of 0.57%).
| Demographics | Rating | Rank | Median Family Income |
| Japanese | 6.0 /100 | #217 | Tragic $97,288 |
| Immigrants | Cambodia | 5.8 /100 | #218 | Tragic $97,222 |
| Delaware | 5.1 /100 | #219 | Tragic $96,958 |
| Sudanese | 4.7 /100 | #220 | Tragic $96,783 |
| Immigrants | Ghana | 4.2 /100 | #221 | Tragic $96,544 |
| Immigrants | Nigeria | 4.0 /100 | #222 | Tragic $96,439 |
| Venezuelans | 3.7 /100 | #223 | Tragic $96,281 |
| Immigrants | Nonimmigrants | 3.6 /100 | #224 | Tragic $96,231 |
| Vietnamese | 3.4 /100 | #225 | Tragic $96,123 |
| Immigrants | Panama | 2.7 /100 | #226 | Tragic $95,647 |
| Alaska Natives | 2.6 /100 | #227 | Tragic $95,573 |
| Immigrants | Azores | 2.4 /100 | #228 | Tragic $95,402 |
| Marshallese | 2.2 /100 | #229 | Tragic $95,293 |
| Malaysians | 2.2 /100 | #230 | Tragic $95,230 |
| Ecuadorians | 2.1 /100 | #231 | Tragic $95,114 |
Demographics Similar to New Zealanders by Median Family Income
In terms of median family income, the demographic groups most similar to New Zealanders are Greek ($115,192, a difference of 0.030%), Immigrants from Indonesia ($115,162, a difference of 0.060%), Lithuanian ($115,395, a difference of 0.14%), Immigrants from Netherlands ($114,987, a difference of 0.21%), and Immigrants from Europe ($115,523, a difference of 0.25%).
| Demographics | Rating | Rank | Median Family Income |
| Chinese | 99.9 /100 | #49 | Exceptional $116,188 |
| Immigrants | Czechoslovakia | 99.9 /100 | #50 | Exceptional $116,165 |
| Immigrants | Malaysia | 99.9 /100 | #51 | Exceptional $115,880 |
| Maltese | 99.9 /100 | #52 | Exceptional $115,862 |
| Immigrants | Norway | 99.9 /100 | #53 | Exceptional $115,847 |
| Immigrants | Europe | 99.9 /100 | #54 | Exceptional $115,523 |
| Lithuanians | 99.8 /100 | #55 | Exceptional $115,395 |
| New Zealanders | 99.8 /100 | #56 | Exceptional $115,230 |
| Greeks | 99.8 /100 | #57 | Exceptional $115,192 |
| Immigrants | Indonesia | 99.8 /100 | #58 | Exceptional $115,162 |
| Immigrants | Netherlands | 99.8 /100 | #59 | Exceptional $114,987 |
| Immigrants | Latvia | 99.8 /100 | #60 | Exceptional $114,826 |
| Immigrants | Belarus | 99.8 /100 | #61 | Exceptional $114,586 |
| Mongolians | 99.8 /100 | #62 | Exceptional $114,553 |
| Immigrants | Pakistan | 99.8 /100 | #63 | Exceptional $114,406 |