Immigrants from Europe vs New Zealander Median Family Income
COMPARE
Immigrants from Europe
New Zealander
Median Family Income
Median Family Income Comparison
Immigrants from Europe
New Zealanders
$115,523
MEDIAN FAMILY INCOME
99.9/ 100
METRIC RATING
54th/ 347
METRIC RANK
$115,230
MEDIAN FAMILY INCOME
99.8/ 100
METRIC RATING
56th/ 347
METRIC RANK
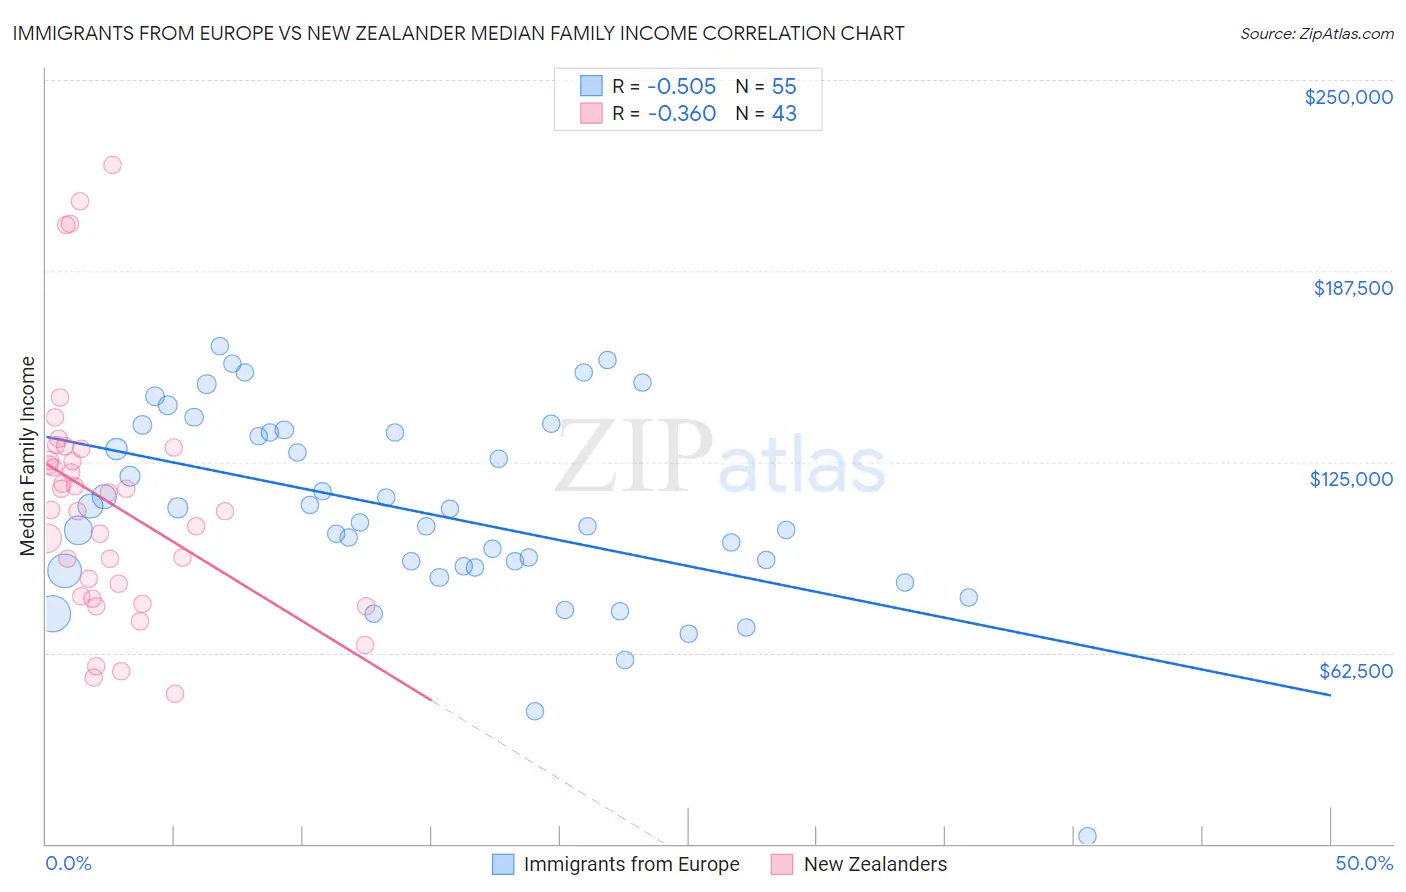
Immigrants from Europe vs New Zealander Median Family Income Correlation Chart
The statistical analysis conducted on geographies consisting of 546,465,722 people shows a substantial negative correlation between the proportion of Immigrants from Europe and median family income in the United States with a correlation coefficient (R) of -0.505 and weighted average of $115,523. Similarly, the statistical analysis conducted on geographies consisting of 106,887,889 people shows a mild negative correlation between the proportion of New Zealanders and median family income in the United States with a correlation coefficient (R) of -0.360 and weighted average of $115,230, a difference of 0.25%.
Median Family Income Correlation Summary
| Measurement | Immigrants from Europe | New Zealander |
| Minimum | $2,499 | $49,107 |
| Maximum | $162,783 | $222,283 |
| Range | $160,284 | $173,176 |
| Mean | $108,657 | $111,963 |
| Median | $105,246 | $109,262 |
| Interquartile 25% (IQ1) | $90,625 | $80,824 |
| Interquartile 75% (IQ3) | $134,559 | $129,386 |
| Interquartile Range (IQR) | $43,934 | $48,562 |
| Standard Deviation (Sample) | $31,673 | $40,212 |
| Standard Deviation (Population) | $31,384 | $39,742 |
Demographics Similar to Immigrants from Europe and New Zealanders by Median Family Income
In terms of median family income, the demographic groups most similar to Immigrants from Europe are Lithuanian ($115,395, a difference of 0.11%), Immigrants from Norway ($115,847, a difference of 0.28%), Maltese ($115,862, a difference of 0.29%), Greek ($115,192, a difference of 0.29%), and Immigrants from Malaysia ($115,880, a difference of 0.31%). Similarly, the demographic groups most similar to New Zealanders are Greek ($115,192, a difference of 0.030%), Immigrants from Indonesia ($115,162, a difference of 0.060%), Lithuanian ($115,395, a difference of 0.14%), Immigrants from Netherlands ($114,987, a difference of 0.21%), and Immigrants from Latvia ($114,826, a difference of 0.35%).
| Demographics | Rating | Rank | Median Family Income |
| Immigrants | Greece | 99.9 /100 | #45 | Exceptional $117,344 |
| Immigrants | Russia | 99.9 /100 | #46 | Exceptional $116,942 |
| Immigrants | Austria | 99.9 /100 | #47 | Exceptional $116,830 |
| Immigrants | South Africa | 99.9 /100 | #48 | Exceptional $116,286 |
| Chinese | 99.9 /100 | #49 | Exceptional $116,188 |
| Immigrants | Czechoslovakia | 99.9 /100 | #50 | Exceptional $116,165 |
| Immigrants | Malaysia | 99.9 /100 | #51 | Exceptional $115,880 |
| Maltese | 99.9 /100 | #52 | Exceptional $115,862 |
| Immigrants | Norway | 99.9 /100 | #53 | Exceptional $115,847 |
| Immigrants | Europe | 99.9 /100 | #54 | Exceptional $115,523 |
| Lithuanians | 99.8 /100 | #55 | Exceptional $115,395 |
| New Zealanders | 99.8 /100 | #56 | Exceptional $115,230 |
| Greeks | 99.8 /100 | #57 | Exceptional $115,192 |
| Immigrants | Indonesia | 99.8 /100 | #58 | Exceptional $115,162 |
| Immigrants | Netherlands | 99.8 /100 | #59 | Exceptional $114,987 |
| Immigrants | Latvia | 99.8 /100 | #60 | Exceptional $114,826 |
| Immigrants | Belarus | 99.8 /100 | #61 | Exceptional $114,586 |
| Mongolians | 99.8 /100 | #62 | Exceptional $114,553 |
| Immigrants | Pakistan | 99.8 /100 | #63 | Exceptional $114,406 |
| Immigrants | Scotland | 99.7 /100 | #64 | Exceptional $114,392 |
| Egyptians | 99.7 /100 | #65 | Exceptional $114,119 |