Nicaraguan vs Immigrants from Ireland Per Capita Income
COMPARE
Nicaraguan
Immigrants from Ireland
Per Capita Income
Per Capita Income Comparison
Nicaraguans
Immigrants from Ireland
$39,372
PER CAPITA INCOME
0.8/ 100
METRIC RATING
257th/ 347
METRIC RANK
$56,584
PER CAPITA INCOME
100.0/ 100
METRIC RATING
9th/ 347
METRIC RANK
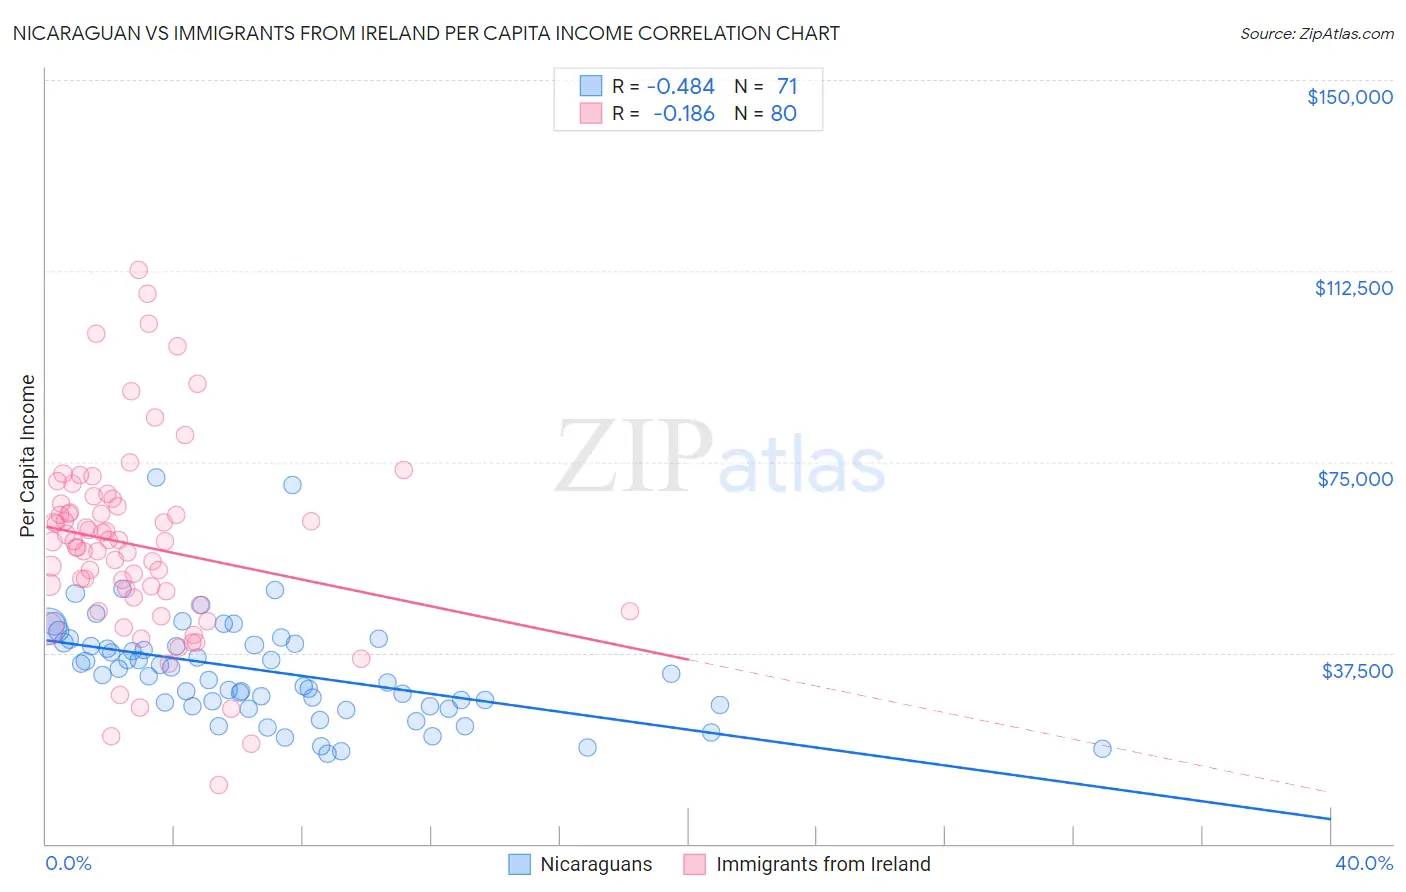
Nicaraguan vs Immigrants from Ireland Per Capita Income Correlation Chart
The statistical analysis conducted on geographies consisting of 285,722,062 people shows a moderate negative correlation between the proportion of Nicaraguans and per capita income in the United States with a correlation coefficient (R) of -0.484 and weighted average of $39,372. Similarly, the statistical analysis conducted on geographies consisting of 240,778,427 people shows a poor negative correlation between the proportion of Immigrants from Ireland and per capita income in the United States with a correlation coefficient (R) of -0.186 and weighted average of $56,584, a difference of 43.7%.
Per Capita Income Correlation Summary
| Measurement | Nicaraguan | Immigrants from Ireland |
| Minimum | $17,623 | $11,481 |
| Maximum | $71,864 | $112,628 |
| Range | $54,241 | $101,147 |
| Mean | $33,908 | $58,619 |
| Median | $33,140 | $59,294 |
| Interquartile 25% (IQ1) | $27,013 | $47,629 |
| Interquartile 75% (IQ3) | $39,273 | $66,537 |
| Interquartile Range (IQR) | $12,260 | $18,908 |
| Standard Deviation (Sample) | $10,352 | $19,021 |
| Standard Deviation (Population) | $10,279 | $18,902 |
Similar Demographics by Per Capita Income
Demographics Similar to Nicaraguans by Per Capita Income
In terms of per capita income, the demographic groups most similar to Nicaraguans are Hawaiian ($39,403, a difference of 0.080%), Jamaican ($39,231, a difference of 0.36%), Immigrants from Middle Africa ($39,529, a difference of 0.40%), Malaysian ($39,194, a difference of 0.46%), and Alaska Native ($39,558, a difference of 0.47%).
| Demographics | Rating | Rank | Per Capita Income |
| Immigrants | Burma/Myanmar | 1.3 /100 | #250 | Tragic $39,827 |
| Samoans | 1.3 /100 | #251 | Tragic $39,826 |
| Immigrants | Azores | 1.0 /100 | #252 | Tragic $39,608 |
| Osage | 1.0 /100 | #253 | Tragic $39,568 |
| Alaska Natives | 1.0 /100 | #254 | Tragic $39,558 |
| Immigrants | Middle Africa | 1.0 /100 | #255 | Tragic $39,529 |
| Hawaiians | 0.8 /100 | #256 | Tragic $39,403 |
| Nicaraguans | 0.8 /100 | #257 | Tragic $39,372 |
| Jamaicans | 0.7 /100 | #258 | Tragic $39,231 |
| Malaysians | 0.7 /100 | #259 | Tragic $39,194 |
| Alaskan Athabascans | 0.6 /100 | #260 | Tragic $39,163 |
| Marshallese | 0.6 /100 | #261 | Tragic $39,108 |
| Iroquois | 0.6 /100 | #262 | Tragic $39,104 |
| Belizeans | 0.6 /100 | #263 | Tragic $39,097 |
| Americans | 0.6 /100 | #264 | Tragic $39,039 |
Demographics Similar to Immigrants from Ireland by Per Capita Income
In terms of per capita income, the demographic groups most similar to Immigrants from Ireland are Immigrants from Hong Kong ($56,709, a difference of 0.22%), Okinawan ($55,817, a difference of 1.4%), Immigrants from Israel ($57,384, a difference of 1.4%), Eastern European ($55,780, a difference of 1.4%), and Immigrants from Sweden ($55,582, a difference of 1.8%).
| Demographics | Rating | Rank | Per Capita Income |
| Iranians | 100.0 /100 | #2 | Exceptional $58,786 |
| Immigrants | Singapore | 100.0 /100 | #3 | Exceptional $58,353 |
| Immigrants | Australia | 100.0 /100 | #4 | Exceptional $57,953 |
| Immigrants | Iran | 100.0 /100 | #5 | Exceptional $57,759 |
| Immigrants | Taiwan | 100.0 /100 | #6 | Exceptional $57,742 |
| Immigrants | Israel | 100.0 /100 | #7 | Exceptional $57,384 |
| Immigrants | Hong Kong | 100.0 /100 | #8 | Exceptional $56,709 |
| Immigrants | Ireland | 100.0 /100 | #9 | Exceptional $56,584 |
| Okinawans | 100.0 /100 | #10 | Exceptional $55,817 |
| Eastern Europeans | 100.0 /100 | #11 | Exceptional $55,780 |
| Immigrants | Sweden | 100.0 /100 | #12 | Exceptional $55,582 |
| Immigrants | India | 100.0 /100 | #13 | Exceptional $55,268 |
| Immigrants | Belgium | 100.0 /100 | #14 | Exceptional $55,082 |
| Cypriots | 100.0 /100 | #15 | Exceptional $54,899 |
| Immigrants | Switzerland | 100.0 /100 | #16 | Exceptional $54,866 |