New Zealander vs Spaniard Median Male Earnings
COMPARE
New Zealander
Spaniard
Median Male Earnings
Median Male Earnings Comparison
New Zealanders
Spaniards
$61,199
MEDIAN MALE EARNINGS
99.9/ 100
METRIC RATING
58th/ 347
METRIC RANK
$54,401
MEDIAN MALE EARNINGS
47.8/ 100
METRIC RATING
176th/ 347
METRIC RANK
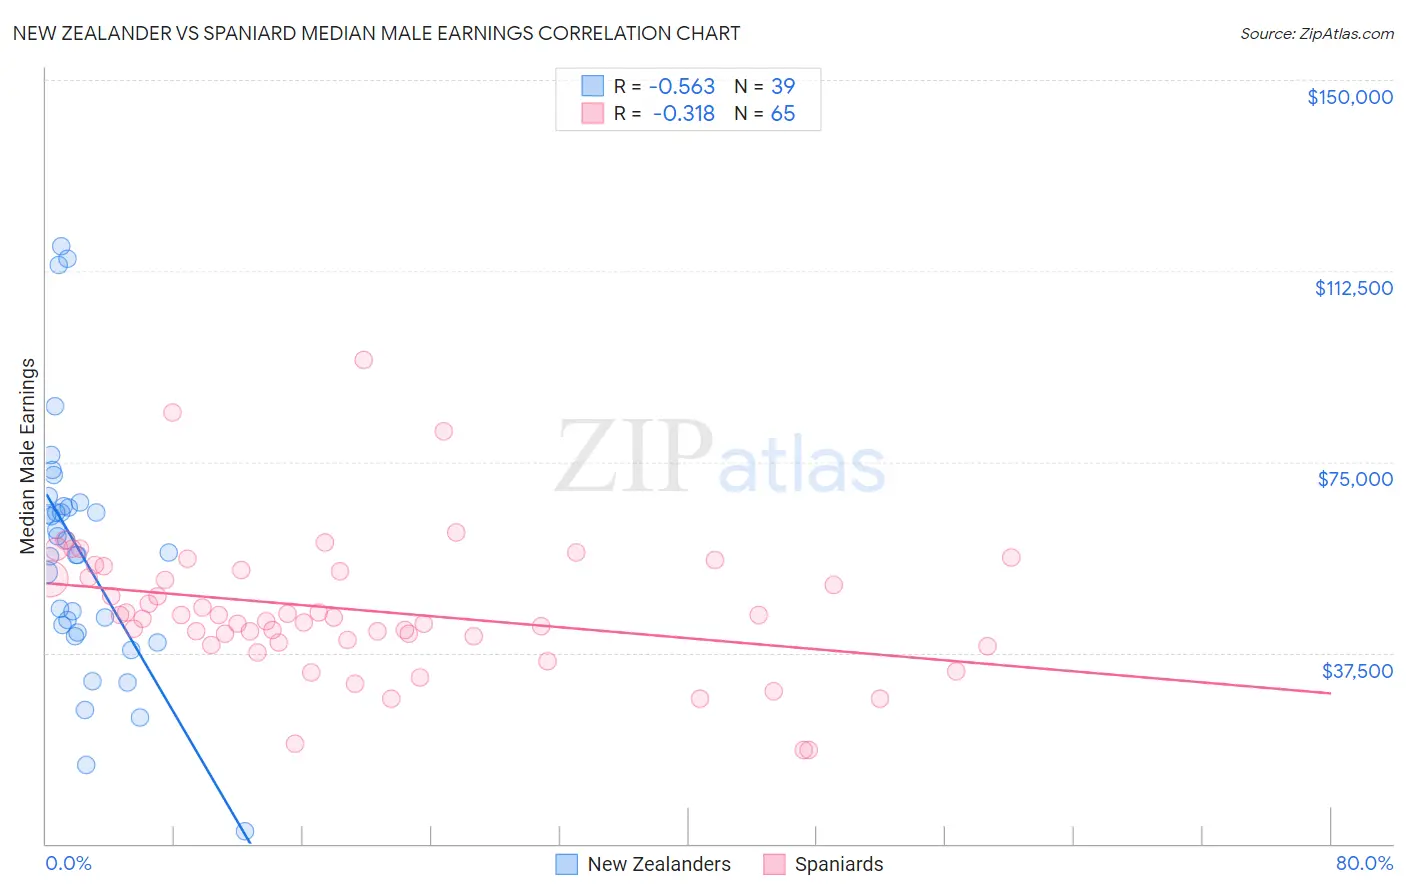
New Zealander vs Spaniard Median Male Earnings Correlation Chart
The statistical analysis conducted on geographies consisting of 106,908,736 people shows a substantial negative correlation between the proportion of New Zealanders and median male earnings in the United States with a correlation coefficient (R) of -0.563 and weighted average of $61,199. Similarly, the statistical analysis conducted on geographies consisting of 443,330,517 people shows a mild negative correlation between the proportion of Spaniards and median male earnings in the United States with a correlation coefficient (R) of -0.318 and weighted average of $54,401, a difference of 12.5%.
Median Male Earnings Correlation Summary
| Measurement | New Zealander | Spaniard |
| Minimum | $2,499 | $18,319 |
| Maximum | $117,445 | $95,000 |
| Range | $114,946 | $76,681 |
| Mean | $57,008 | $45,902 |
| Median | $57,308 | $44,474 |
| Interquartile 25% (IQ1) | $41,429 | $39,886 |
| Interquartile 75% (IQ3) | $66,406 | $53,625 |
| Interquartile Range (IQR) | $24,977 | $13,740 |
| Standard Deviation (Sample) | $24,372 | $13,482 |
| Standard Deviation (Population) | $24,057 | $13,378 |
Similar Demographics by Median Male Earnings
Demographics Similar to New Zealanders by Median Male Earnings
In terms of median male earnings, the demographic groups most similar to New Zealanders are Immigrants from Scotland ($61,220, a difference of 0.030%), Lithuanian ($61,228, a difference of 0.050%), Greek ($61,242, a difference of 0.070%), Immigrants from Netherlands ($61,096, a difference of 0.17%), and Egyptian ($61,095, a difference of 0.17%).
| Demographics | Rating | Rank | Median Male Earnings |
| Estonians | 99.9 /100 | #51 | Exceptional $61,710 |
| Immigrants | Norway | 99.9 /100 | #52 | Exceptional $61,628 |
| South Africans | 99.9 /100 | #53 | Exceptional $61,460 |
| Immigrants | Latvia | 99.9 /100 | #54 | Exceptional $61,422 |
| Greeks | 99.9 /100 | #55 | Exceptional $61,242 |
| Lithuanians | 99.9 /100 | #56 | Exceptional $61,228 |
| Immigrants | Scotland | 99.9 /100 | #57 | Exceptional $61,220 |
| New Zealanders | 99.9 /100 | #58 | Exceptional $61,199 |
| Immigrants | Netherlands | 99.8 /100 | #59 | Exceptional $61,096 |
| Egyptians | 99.8 /100 | #60 | Exceptional $61,095 |
| Bolivians | 99.8 /100 | #61 | Exceptional $61,066 |
| Immigrants | Romania | 99.8 /100 | #62 | Exceptional $61,040 |
| Immigrants | Pakistan | 99.8 /100 | #63 | Exceptional $60,987 |
| Immigrants | Eastern Europe | 99.8 /100 | #64 | Exceptional $60,958 |
| Immigrants | Indonesia | 99.8 /100 | #65 | Exceptional $60,935 |
Demographics Similar to Spaniards by Median Male Earnings
In terms of median male earnings, the demographic groups most similar to Spaniards are Dutch ($54,410, a difference of 0.020%), South American ($54,492, a difference of 0.17%), South American Indian ($54,508, a difference of 0.20%), Costa Rican ($54,279, a difference of 0.22%), and Sierra Leonean ($54,279, a difference of 0.22%).
| Demographics | Rating | Rank | Median Male Earnings |
| French Canadians | 55.6 /100 | #169 | Average $54,722 |
| Finns | 55.6 /100 | #170 | Average $54,721 |
| Immigrants | Peru | 54.9 /100 | #171 | Average $54,695 |
| Welsh | 53.8 /100 | #172 | Average $54,647 |
| South American Indians | 50.4 /100 | #173 | Average $54,508 |
| South Americans | 50.0 /100 | #174 | Average $54,492 |
| Dutch | 48.0 /100 | #175 | Average $54,410 |
| Spaniards | 47.8 /100 | #176 | Average $54,401 |
| Costa Ricans | 44.8 /100 | #177 | Average $54,279 |
| Sierra Leoneans | 44.8 /100 | #178 | Average $54,279 |
| Celtics | 43.9 /100 | #179 | Average $54,242 |
| Iraqis | 42.5 /100 | #180 | Average $54,182 |
| Immigrants | Immigrants | 42.1 /100 | #181 | Average $54,168 |
| Yugoslavians | 37.4 /100 | #182 | Fair $53,967 |
| Immigrants | South America | 37.3 /100 | #183 | Fair $53,962 |