Immigrants from Fiji vs Spaniard Median Male Earnings
COMPARE
Immigrants from Fiji
Spaniard
Median Male Earnings
Median Male Earnings Comparison
Immigrants from Fiji
Spaniards
$54,958
MEDIAN MALE EARNINGS
61.2/ 100
METRIC RATING
167th/ 347
METRIC RANK
$54,401
MEDIAN MALE EARNINGS
47.8/ 100
METRIC RATING
176th/ 347
METRIC RANK
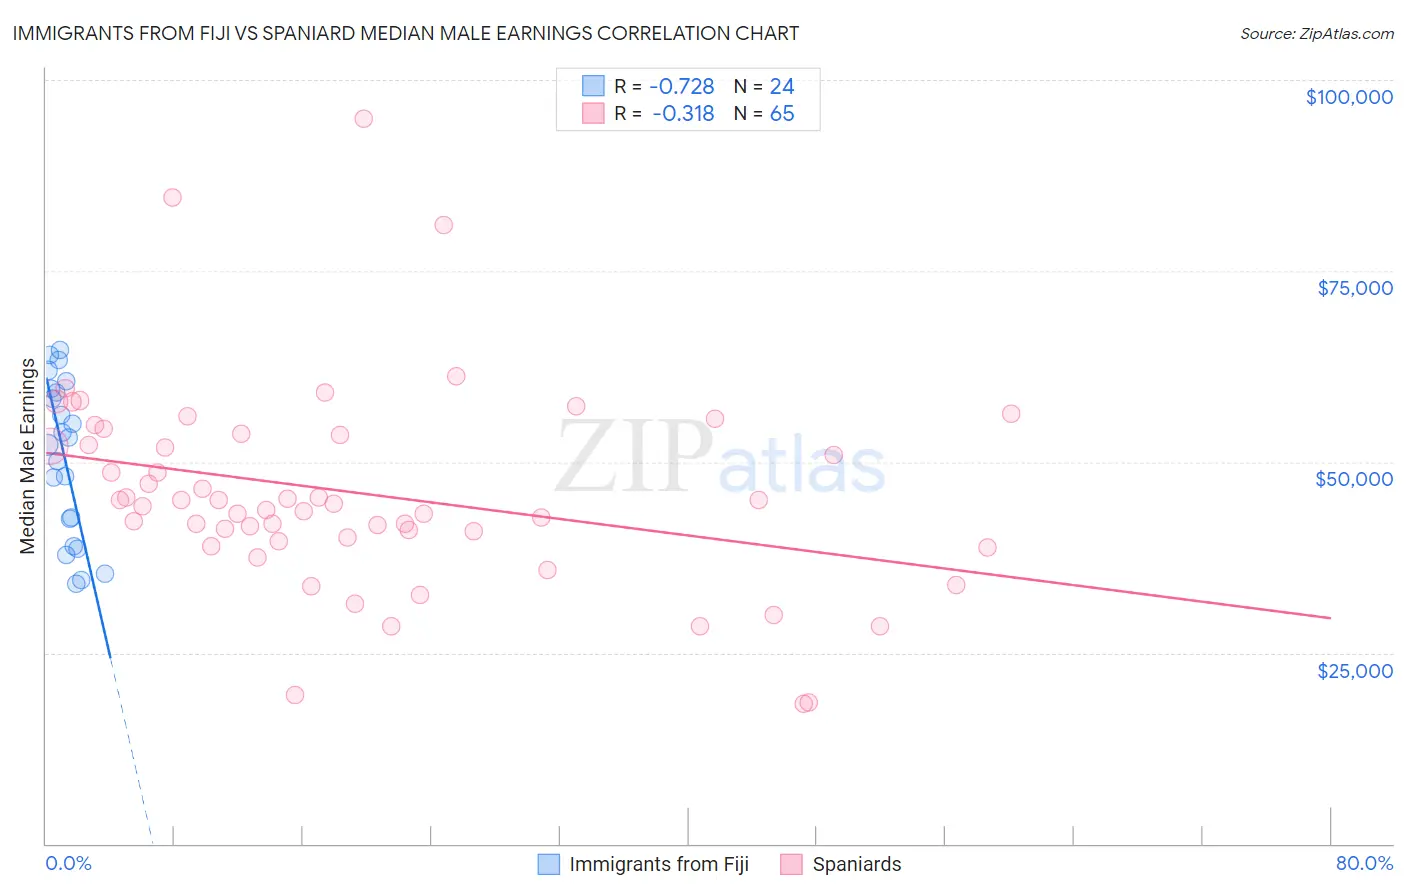
Immigrants from Fiji vs Spaniard Median Male Earnings Correlation Chart
The statistical analysis conducted on geographies consisting of 93,749,619 people shows a strong negative correlation between the proportion of Immigrants from Fiji and median male earnings in the United States with a correlation coefficient (R) of -0.728 and weighted average of $54,958. Similarly, the statistical analysis conducted on geographies consisting of 443,330,517 people shows a mild negative correlation between the proportion of Spaniards and median male earnings in the United States with a correlation coefficient (R) of -0.318 and weighted average of $54,401, a difference of 1.0%.
Median Male Earnings Correlation Summary
| Measurement | Immigrants from Fiji | Spaniard |
| Minimum | $34,054 | $18,319 |
| Maximum | $64,713 | $95,000 |
| Range | $30,659 | $76,681 |
| Mean | $50,520 | $45,902 |
| Median | $52,738 | $44,474 |
| Interquartile 25% (IQ1) | $40,707 | $39,886 |
| Interquartile 75% (IQ3) | $59,322 | $53,625 |
| Interquartile Range (IQR) | $18,615 | $13,740 |
| Standard Deviation (Sample) | $10,211 | $13,482 |
| Standard Deviation (Population) | $9,996 | $13,378 |
Demographics Similar to Immigrants from Fiji and Spaniards by Median Male Earnings
In terms of median male earnings, the demographic groups most similar to Immigrants from Fiji are German ($54,974, a difference of 0.030%), Immigrants from Vietnam ($54,913, a difference of 0.080%), Immigrants from Portugal ($55,182, a difference of 0.41%), French Canadian ($54,722, a difference of 0.43%), and Finnish ($54,721, a difference of 0.43%). Similarly, the demographic groups most similar to Spaniards are Dutch ($54,410, a difference of 0.020%), South American ($54,492, a difference of 0.17%), South American Indian ($54,508, a difference of 0.20%), Costa Rican ($54,279, a difference of 0.22%), and Sierra Leonean ($54,279, a difference of 0.22%).
| Demographics | Rating | Rank | Median Male Earnings |
| Belgians | 70.1 /100 | #161 | Good $55,361 |
| French | 69.9 /100 | #162 | Good $55,350 |
| Ugandans | 68.6 /100 | #163 | Good $55,290 |
| Immigrants | South Eastern Asia | 67.6 /100 | #164 | Good $55,241 |
| Immigrants | Portugal | 66.3 /100 | #165 | Good $55,182 |
| Germans | 61.6 /100 | #166 | Good $54,974 |
| Immigrants | Fiji | 61.2 /100 | #167 | Good $54,958 |
| Immigrants | Vietnam | 60.2 /100 | #168 | Good $54,913 |
| French Canadians | 55.6 /100 | #169 | Average $54,722 |
| Finns | 55.6 /100 | #170 | Average $54,721 |
| Immigrants | Peru | 54.9 /100 | #171 | Average $54,695 |
| Welsh | 53.8 /100 | #172 | Average $54,647 |
| South American Indians | 50.4 /100 | #173 | Average $54,508 |
| South Americans | 50.0 /100 | #174 | Average $54,492 |
| Dutch | 48.0 /100 | #175 | Average $54,410 |
| Spaniards | 47.8 /100 | #176 | Average $54,401 |
| Costa Ricans | 44.8 /100 | #177 | Average $54,279 |
| Sierra Leoneans | 44.8 /100 | #178 | Average $54,279 |
| Celtics | 43.9 /100 | #179 | Average $54,242 |
| Iraqis | 42.5 /100 | #180 | Average $54,182 |
| Immigrants | Immigrants | 42.1 /100 | #181 | Average $54,168 |