New Zealander vs Spaniard Female Unemployment
COMPARE
New Zealander
Spaniard
Female Unemployment
Female Unemployment Comparison
New Zealanders
Spaniards
5.0%
FEMALE UNEMPLOYMENT
97.4/ 100
METRIC RATING
80th/ 347
METRIC RANK
5.3%
FEMALE UNEMPLOYMENT
25.2/ 100
METRIC RATING
196th/ 347
METRIC RANK
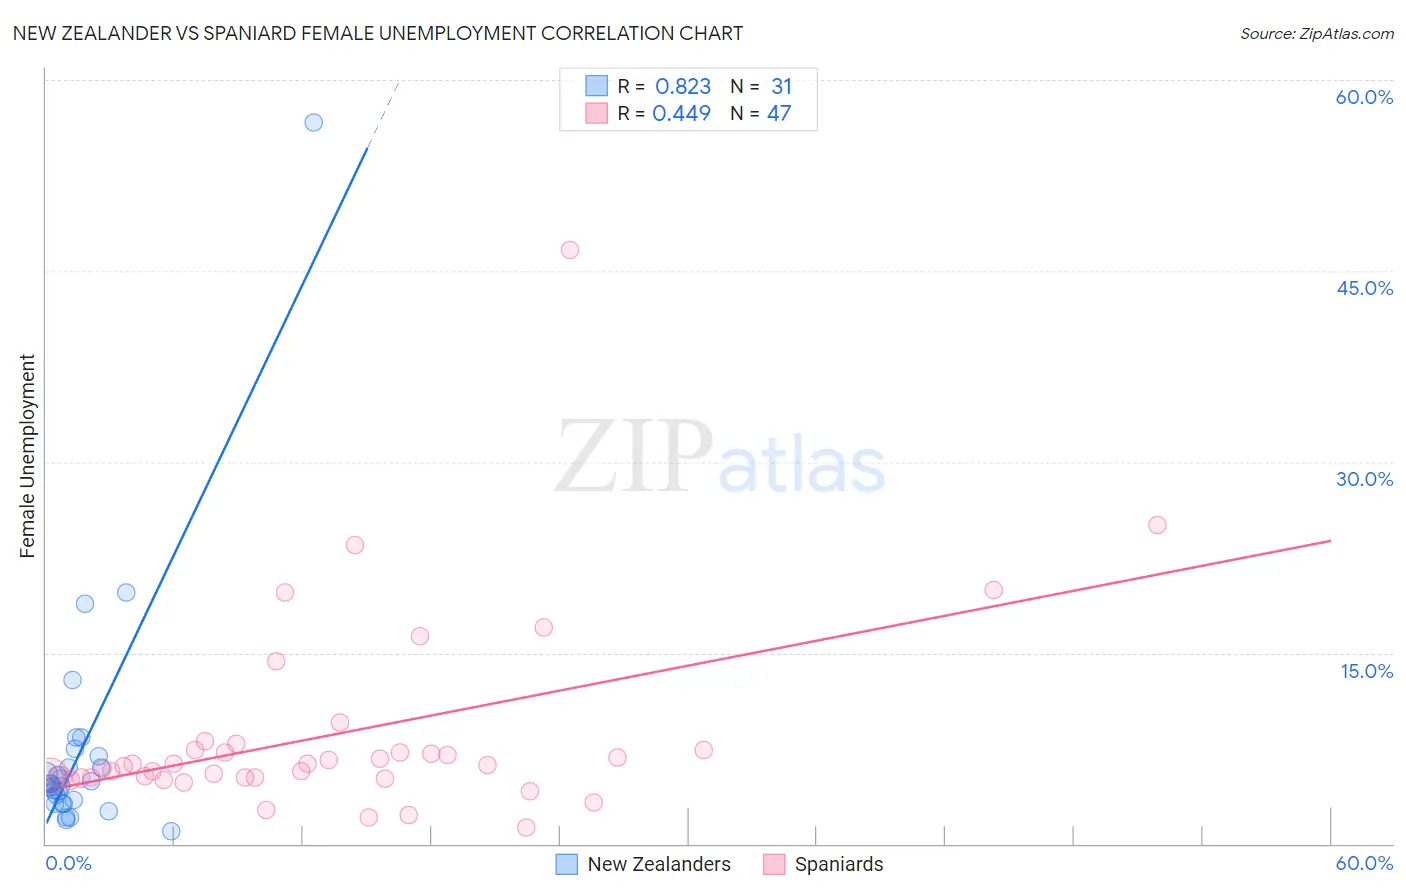
New Zealander vs Spaniard Female Unemployment Correlation Chart
The statistical analysis conducted on geographies consisting of 106,766,859 people shows a very strong positive correlation between the proportion of New Zealanders and unemploymnet rate among females in the United States with a correlation coefficient (R) of 0.823 and weighted average of 5.0%. Similarly, the statistical analysis conducted on geographies consisting of 440,755,407 people shows a moderate positive correlation between the proportion of Spaniards and unemploymnet rate among females in the United States with a correlation coefficient (R) of 0.449 and weighted average of 5.3%, a difference of 7.5%.
Female Unemployment Correlation Summary
| Measurement | New Zealander | Spaniard |
| Minimum | 1.0% | 1.3% |
| Maximum | 56.7% | 46.6% |
| Range | 55.7% | 45.3% |
| Mean | 7.4% | 8.6% |
| Median | 4.7% | 6.2% |
| Interquartile 25% (IQ1) | 3.2% | 5.2% |
| Interquartile 75% (IQ3) | 6.9% | 7.4% |
| Interquartile Range (IQR) | 3.7% | 2.2% |
| Standard Deviation (Sample) | 10.1% | 7.8% |
| Standard Deviation (Population) | 9.9% | 7.7% |
Similar Demographics by Female Unemployment
Demographics Similar to New Zealanders by Female Unemployment
In terms of female unemployment, the demographic groups most similar to New Zealanders are Filipino (5.0%, a difference of 0.020%), Immigrants from Australia (5.0%, a difference of 0.070%), Immigrants from Serbia (5.0%, a difference of 0.090%), Turkish (5.0%, a difference of 0.12%), and Canadian (5.0%, a difference of 0.13%).
| Demographics | Rating | Rank | Female Unemployment |
| Russians | 98.0 /100 | #73 | Exceptional 5.0% |
| Immigrants | Bolivia | 98.0 /100 | #74 | Exceptional 5.0% |
| Immigrants | Singapore | 98.0 /100 | #75 | Exceptional 5.0% |
| Immigrants | Venezuela | 97.9 /100 | #76 | Exceptional 5.0% |
| Mongolians | 97.8 /100 | #77 | Exceptional 5.0% |
| Immigrants | Netherlands | 97.8 /100 | #78 | Exceptional 5.0% |
| Turks | 97.6 /100 | #79 | Exceptional 5.0% |
| New Zealanders | 97.4 /100 | #80 | Exceptional 5.0% |
| Filipinos | 97.3 /100 | #81 | Exceptional 5.0% |
| Immigrants | Australia | 97.3 /100 | #82 | Exceptional 5.0% |
| Immigrants | Serbia | 97.2 /100 | #83 | Exceptional 5.0% |
| Canadians | 97.2 /100 | #84 | Exceptional 5.0% |
| Ukrainians | 97.1 /100 | #85 | Exceptional 5.0% |
| Bolivians | 97.1 /100 | #86 | Exceptional 5.0% |
| Venezuelans | 96.9 /100 | #87 | Exceptional 5.0% |
Demographics Similar to Spaniards by Female Unemployment
In terms of female unemployment, the demographic groups most similar to Spaniards are Immigrants from Colombia (5.3%, a difference of 0.080%), Alsatian (5.3%, a difference of 0.10%), Colombian (5.3%, a difference of 0.14%), Tsimshian (5.4%, a difference of 0.17%), and Arab (5.3%, a difference of 0.19%).
| Demographics | Rating | Rank | Female Unemployment |
| Costa Ricans | 33.8 /100 | #189 | Fair 5.3% |
| Ugandans | 31.2 /100 | #190 | Fair 5.3% |
| Cherokee | 30.8 /100 | #191 | Fair 5.3% |
| Portuguese | 28.6 /100 | #192 | Fair 5.3% |
| Arabs | 27.7 /100 | #193 | Fair 5.3% |
| Colombians | 27.0 /100 | #194 | Fair 5.3% |
| Immigrants | Colombia | 26.2 /100 | #195 | Fair 5.3% |
| Spaniards | 25.2 /100 | #196 | Fair 5.3% |
| Alsatians | 23.9 /100 | #197 | Fair 5.3% |
| Tsimshian | 23.1 /100 | #198 | Fair 5.4% |
| Hawaiians | 22.2 /100 | #199 | Fair 5.4% |
| Soviet Union | 21.7 /100 | #200 | Fair 5.4% |
| Immigrants | Middle Africa | 20.8 /100 | #201 | Fair 5.4% |
| Iroquois | 20.8 /100 | #202 | Fair 5.4% |
| Immigrants | South Eastern Asia | 20.3 /100 | #203 | Fair 5.4% |