Nepalese vs Immigrants from Switzerland Median Female Earnings
COMPARE
Nepalese
Immigrants from Switzerland
Median Female Earnings
Median Female Earnings Comparison
Nepalese
Immigrants from Switzerland
$38,603
MEDIAN FEMALE EARNINGS
9.3/ 100
METRIC RATING
219th/ 347
METRIC RANK
$43,996
MEDIAN FEMALE EARNINGS
100.0/ 100
METRIC RATING
37th/ 347
METRIC RANK
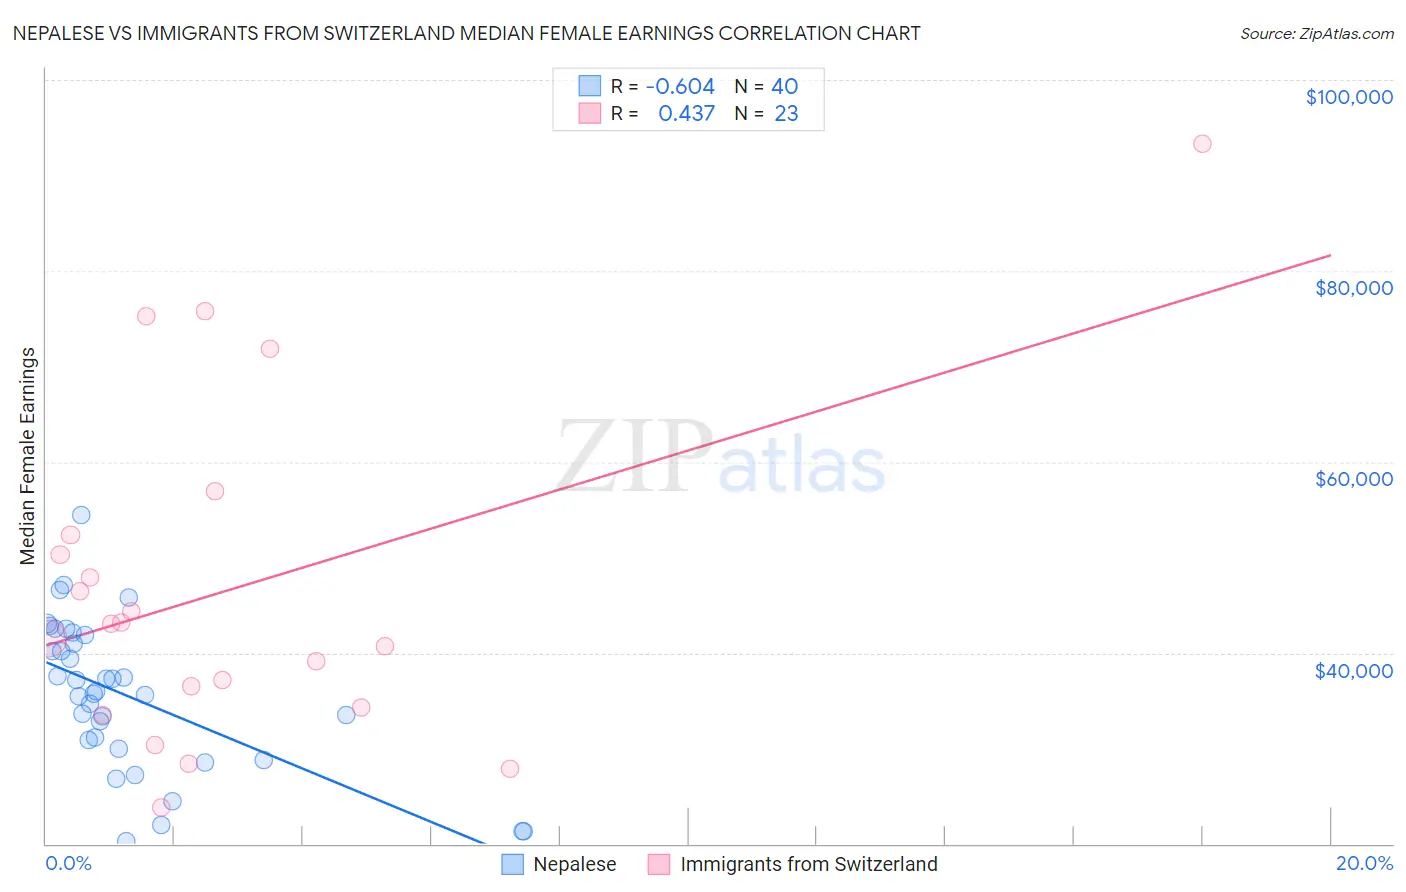
Nepalese vs Immigrants from Switzerland Median Female Earnings Correlation Chart
The statistical analysis conducted on geographies consisting of 24,521,755 people shows a significant negative correlation between the proportion of Nepalese and median female earnings in the United States with a correlation coefficient (R) of -0.604 and weighted average of $38,603. Similarly, the statistical analysis conducted on geographies consisting of 148,042,393 people shows a moderate positive correlation between the proportion of Immigrants from Switzerland and median female earnings in the United States with a correlation coefficient (R) of 0.437 and weighted average of $43,996, a difference of 14.0%.
Median Female Earnings Correlation Summary
| Measurement | Nepalese | Immigrants from Switzerland |
| Minimum | $20,210 | $23,823 |
| Maximum | $54,407 | $93,289 |
| Range | $34,197 | $69,466 |
| Mean | $35,483 | $46,683 |
| Median | $35,860 | $43,003 |
| Interquartile 25% (IQ1) | $30,426 | $34,297 |
| Interquartile 75% (IQ3) | $41,423 | $52,304 |
| Interquartile Range (IQR) | $10,997 | $18,007 |
| Standard Deviation (Sample) | $7,837 | $17,546 |
| Standard Deviation (Population) | $7,738 | $17,160 |
Similar Demographics by Median Female Earnings
Demographics Similar to Nepalese by Median Female Earnings
In terms of median female earnings, the demographic groups most similar to Nepalese are Cape Verdean ($38,614, a difference of 0.030%), Immigrants from Jamaica ($38,625, a difference of 0.060%), Yugoslavian ($38,573, a difference of 0.080%), Immigrants from the Azores ($38,573, a difference of 0.080%), and Immigrants from Ecuador ($38,644, a difference of 0.11%).
| Demographics | Rating | Rank | Median Female Earnings |
| Guamanians/Chamorros | 11.5 /100 | #212 | Poor $38,717 |
| Jamaicans | 10.5 /100 | #213 | Poor $38,670 |
| Iraqis | 10.5 /100 | #214 | Poor $38,666 |
| Spaniards | 10.3 /100 | #215 | Poor $38,656 |
| Immigrants | Ecuador | 10.1 /100 | #216 | Poor $38,644 |
| Immigrants | Jamaica | 9.7 /100 | #217 | Tragic $38,625 |
| Cape Verdeans | 9.5 /100 | #218 | Tragic $38,614 |
| Nepalese | 9.3 /100 | #219 | Tragic $38,603 |
| Yugoslavians | 8.8 /100 | #220 | Tragic $38,573 |
| Immigrants | Azores | 8.8 /100 | #221 | Tragic $38,573 |
| Japanese | 8.1 /100 | #222 | Tragic $38,528 |
| Immigrants | Sudan | 7.8 /100 | #223 | Tragic $38,511 |
| Native Hawaiians | 7.1 /100 | #224 | Tragic $38,461 |
| French | 7.0 /100 | #225 | Tragic $38,457 |
| French Canadians | 6.8 /100 | #226 | Tragic $38,436 |
Demographics Similar to Immigrants from Switzerland by Median Female Earnings
In terms of median female earnings, the demographic groups most similar to Immigrants from Switzerland are Latvian ($43,941, a difference of 0.12%), Immigrants from Turkey ($44,066, a difference of 0.16%), Israeli ($43,852, a difference of 0.33%), Immigrants from Sri Lanka ($44,161, a difference of 0.37%), and Immigrants from Malaysia ($43,835, a difference of 0.37%).
| Demographics | Rating | Rank | Median Female Earnings |
| Asians | 100.0 /100 | #30 | Exceptional $44,586 |
| Immigrants | France | 100.0 /100 | #31 | Exceptional $44,541 |
| Immigrants | Northern Europe | 100.0 /100 | #32 | Exceptional $44,366 |
| Immigrants | Asia | 100.0 /100 | #33 | Exceptional $44,198 |
| Russians | 100.0 /100 | #34 | Exceptional $44,169 |
| Immigrants | Sri Lanka | 100.0 /100 | #35 | Exceptional $44,161 |
| Immigrants | Turkey | 100.0 /100 | #36 | Exceptional $44,066 |
| Immigrants | Switzerland | 100.0 /100 | #37 | Exceptional $43,996 |
| Latvians | 100.0 /100 | #38 | Exceptional $43,941 |
| Israelis | 100.0 /100 | #39 | Exceptional $43,852 |
| Immigrants | Malaysia | 100.0 /100 | #40 | Exceptional $43,835 |
| Bhutanese | 100.0 /100 | #41 | Exceptional $43,648 |
| Immigrants | Denmark | 100.0 /100 | #42 | Exceptional $43,646 |
| Bulgarians | 100.0 /100 | #43 | Exceptional $43,638 |
| Immigrants | Czechoslovakia | 100.0 /100 | #44 | Exceptional $43,571 |