Immigrants from Trinidad and Tobago vs South American Indian Median Household Income
COMPARE
Immigrants from Trinidad and Tobago
South American Indian
Median Household Income
Median Household Income Comparison
Immigrants from Trinidad and Tobago
South American Indians
$80,373
MEDIAN HOUSEHOLD INCOME
4.6/ 100
METRIC RATING
232nd/ 347
METRIC RANK
$87,446
MEDIAN HOUSEHOLD INCOME
81.8/ 100
METRIC RATING
147th/ 347
METRIC RANK
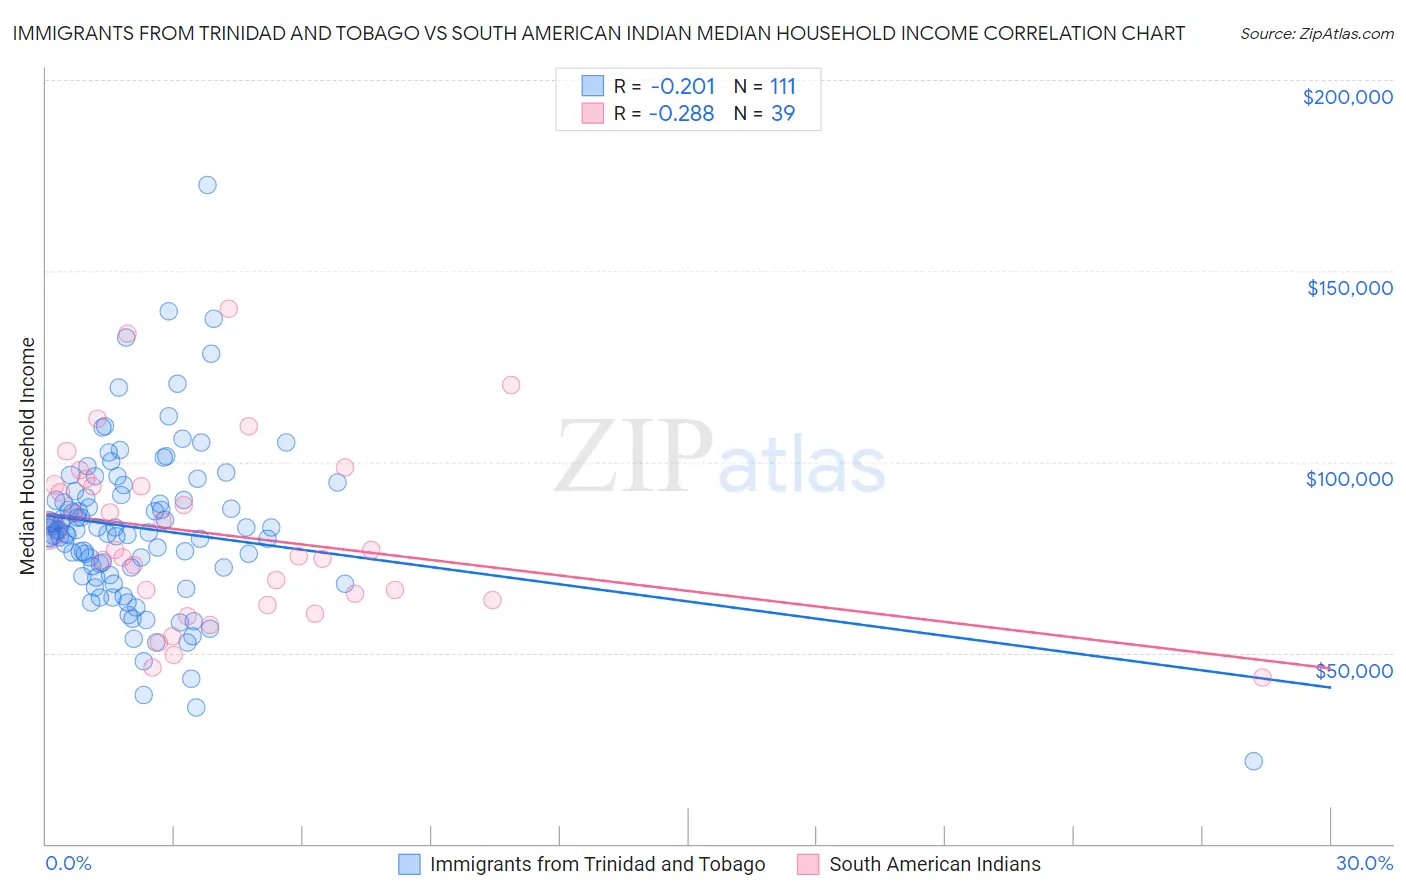
Immigrants from Trinidad and Tobago vs South American Indian Median Household Income Correlation Chart
The statistical analysis conducted on geographies consisting of 223,468,612 people shows a weak negative correlation between the proportion of Immigrants from Trinidad and Tobago and median household income in the United States with a correlation coefficient (R) of -0.201 and weighted average of $80,373. Similarly, the statistical analysis conducted on geographies consisting of 164,527,157 people shows a weak negative correlation between the proportion of South American Indians and median household income in the United States with a correlation coefficient (R) of -0.288 and weighted average of $87,446, a difference of 8.8%.
Median Household Income Correlation Summary
| Measurement | Immigrants from Trinidad and Tobago | South American Indian |
| Minimum | $21,629 | $43,438 |
| Maximum | $172,500 | $140,082 |
| Range | $150,871 | $96,644 |
| Mean | $82,579 | $80,839 |
| Median | $82,052 | $76,875 |
| Interquartile 25% (IQ1) | $70,433 | $63,676 |
| Interquartile 75% (IQ3) | $91,223 | $93,892 |
| Interquartile Range (IQR) | $20,791 | $30,216 |
| Standard Deviation (Sample) | $21,636 | $22,835 |
| Standard Deviation (Population) | $21,539 | $22,540 |
Similar Demographics by Median Household Income
Demographics Similar to Immigrants from Trinidad and Tobago by Median Household Income
In terms of median household income, the demographic groups most similar to Immigrants from Trinidad and Tobago are Immigrants from the Azores ($80,357, a difference of 0.020%), Bermudan ($80,406, a difference of 0.040%), Trinidadian and Tobagonian ($80,402, a difference of 0.040%), Immigrants from Ecuador ($80,341, a difference of 0.040%), and Immigrants from Guyana ($80,324, a difference of 0.060%).
| Demographics | Rating | Rank | Median Household Income |
| Scotch-Irish | 6.6 /100 | #225 | Tragic $80,972 |
| Immigrants | Panama | 6.2 /100 | #226 | Tragic $80,873 |
| Guyanese | 5.7 /100 | #227 | Tragic $80,734 |
| Immigrants | Bangladesh | 5.7 /100 | #228 | Tragic $80,722 |
| Delaware | 5.0 /100 | #229 | Tragic $80,527 |
| Bermudans | 4.7 /100 | #230 | Tragic $80,406 |
| Trinidadians and Tobagonians | 4.7 /100 | #231 | Tragic $80,402 |
| Immigrants | Trinidad and Tobago | 4.6 /100 | #232 | Tragic $80,373 |
| Immigrants | Azores | 4.5 /100 | #233 | Tragic $80,357 |
| Immigrants | Ecuador | 4.5 /100 | #234 | Tragic $80,341 |
| Immigrants | Guyana | 4.5 /100 | #235 | Tragic $80,324 |
| Immigrants | Bosnia and Herzegovina | 3.4 /100 | #236 | Tragic $79,888 |
| Nicaraguans | 3.1 /100 | #237 | Tragic $79,737 |
| Barbadians | 3.0 /100 | #238 | Tragic $79,664 |
| Alaska Natives | 2.7 /100 | #239 | Tragic $79,509 |
Demographics Similar to South American Indians by Median Household Income
In terms of median household income, the demographic groups most similar to South American Indians are Immigrants from Uganda ($87,553, a difference of 0.12%), Ugandan ($87,557, a difference of 0.13%), Serbian ($87,572, a difference of 0.14%), Costa Rican ($87,262, a difference of 0.21%), and Danish ($87,676, a difference of 0.26%).
| Demographics | Rating | Rank | Median Household Income |
| Lebanese | 87.2 /100 | #140 | Excellent $88,091 |
| Immigrants | Morocco | 86.0 /100 | #141 | Excellent $87,930 |
| Canadians | 84.7 /100 | #142 | Excellent $87,769 |
| Danes | 83.9 /100 | #143 | Excellent $87,676 |
| Serbians | 83.0 /100 | #144 | Excellent $87,572 |
| Ugandans | 82.9 /100 | #145 | Excellent $87,557 |
| Immigrants | Uganda | 82.8 /100 | #146 | Excellent $87,553 |
| South American Indians | 81.8 /100 | #147 | Excellent $87,446 |
| Costa Ricans | 80.0 /100 | #148 | Excellent $87,262 |
| Immigrants | Nepal | 77.7 /100 | #149 | Good $87,046 |
| Basques | 77.2 /100 | #150 | Good $87,001 |
| Hungarians | 76.3 /100 | #151 | Good $86,920 |
| Immigrants | Saudi Arabia | 75.8 /100 | #152 | Good $86,875 |
| South Americans | 75.1 /100 | #153 | Good $86,824 |
| Immigrants | Germany | 74.4 /100 | #154 | Good $86,764 |