Native/Alaskan vs Immigrants from Romania Median Earnings
COMPARE
Native/Alaskan
Immigrants from Romania
Median Earnings
Median Earnings Comparison
Natives/Alaskans
Immigrants from Romania
$38,896
MEDIAN EARNINGS
0.0/ 100
METRIC RATING
335th/ 347
METRIC RANK
$51,337
MEDIAN EARNINGS
99.9/ 100
METRIC RATING
62nd/ 347
METRIC RANK
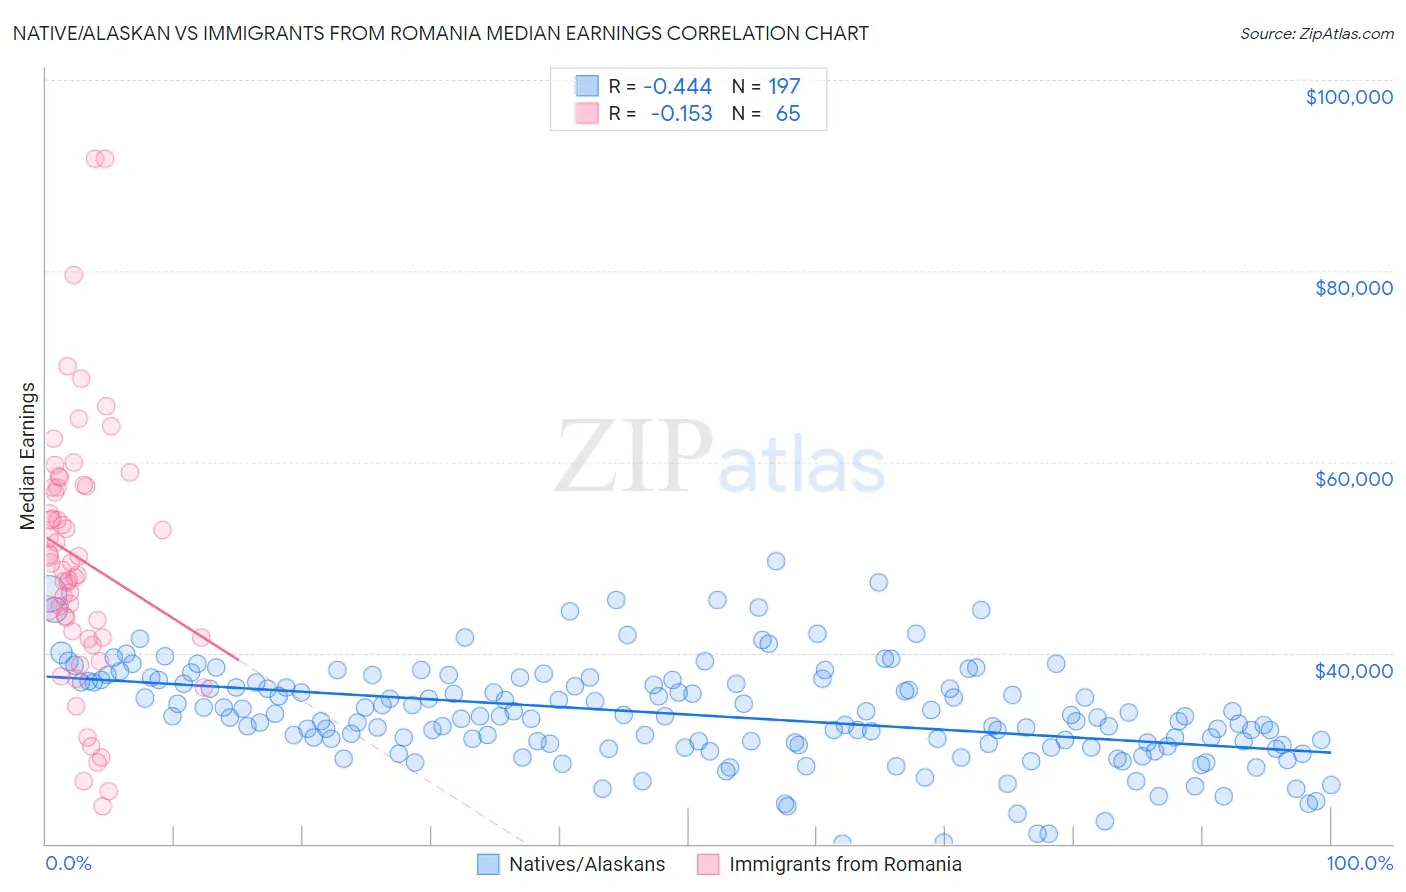
Native/Alaskan vs Immigrants from Romania Median Earnings Correlation Chart
The statistical analysis conducted on geographies consisting of 512,831,083 people shows a moderate negative correlation between the proportion of Natives/Alaskans and median earnings in the United States with a correlation coefficient (R) of -0.444 and weighted average of $38,896. Similarly, the statistical analysis conducted on geographies consisting of 257,003,110 people shows a poor negative correlation between the proportion of Immigrants from Romania and median earnings in the United States with a correlation coefficient (R) of -0.153 and weighted average of $51,337, a difference of 32.0%.
Median Earnings Correlation Summary
| Measurement | Native/Alaskan | Immigrants from Romania |
| Minimum | $20,036 | $23,864 |
| Maximum | $49,581 | $91,786 |
| Range | $29,544 | $67,922 |
| Mean | $33,526 | $49,856 |
| Median | $33,302 | $49,415 |
| Interquartile 25% (IQ1) | $30,416 | $41,640 |
| Interquartile 75% (IQ3) | $36,881 | $57,433 |
| Interquartile Range (IQR) | $6,465 | $15,793 |
| Standard Deviation (Sample) | $5,244 | $13,572 |
| Standard Deviation (Population) | $5,231 | $13,467 |
Similar Demographics by Median Earnings
Demographics Similar to Natives/Alaskans by Median Earnings
In terms of median earnings, the demographic groups most similar to Natives/Alaskans are Spanish American Indian ($38,907, a difference of 0.030%), Houma ($38,949, a difference of 0.14%), Crow ($38,707, a difference of 0.49%), Yakama ($39,107, a difference of 0.54%), and Immigrants from Mexico ($39,114, a difference of 0.56%).
| Demographics | Rating | Rank | Median Earnings |
| Sioux | 0.0 /100 | #328 | Tragic $39,448 |
| Kiowa | 0.0 /100 | #329 | Tragic $39,232 |
| Immigrants | Congo | 0.0 /100 | #330 | Tragic $39,169 |
| Immigrants | Mexico | 0.0 /100 | #331 | Tragic $39,114 |
| Yakama | 0.0 /100 | #332 | Tragic $39,107 |
| Houma | 0.0 /100 | #333 | Tragic $38,949 |
| Spanish American Indians | 0.0 /100 | #334 | Tragic $38,907 |
| Natives/Alaskans | 0.0 /100 | #335 | Tragic $38,896 |
| Crow | 0.0 /100 | #336 | Tragic $38,707 |
| Immigrants | Cuba | 0.0 /100 | #337 | Tragic $38,426 |
| Pima | 0.0 /100 | #338 | Tragic $38,285 |
| Menominee | 0.0 /100 | #339 | Tragic $37,884 |
| Navajo | 0.0 /100 | #340 | Tragic $36,999 |
| Lumbee | 0.0 /100 | #341 | Tragic $36,876 |
| Hopi | 0.0 /100 | #342 | Tragic $36,871 |
Demographics Similar to Immigrants from Romania by Median Earnings
In terms of median earnings, the demographic groups most similar to Immigrants from Romania are Immigrants from Bulgaria ($51,318, a difference of 0.040%), New Zealander ($51,246, a difference of 0.18%), Greek ($51,164, a difference of 0.34%), Immigrants from Latvia ($51,555, a difference of 0.42%), and Immigrants from Serbia ($51,557, a difference of 0.43%).
| Demographics | Rating | Rank | Median Earnings |
| Egyptians | 99.9 /100 | #55 | Exceptional $51,701 |
| Immigrants | Pakistan | 99.9 /100 | #56 | Exceptional $51,693 |
| Immigrants | Eastern Europe | 99.9 /100 | #57 | Exceptional $51,624 |
| Immigrants | Bolivia | 99.9 /100 | #58 | Exceptional $51,605 |
| Immigrants | Croatia | 99.9 /100 | #59 | Exceptional $51,581 |
| Immigrants | Serbia | 99.9 /100 | #60 | Exceptional $51,557 |
| Immigrants | Latvia | 99.9 /100 | #61 | Exceptional $51,555 |
| Immigrants | Romania | 99.9 /100 | #62 | Exceptional $51,337 |
| Immigrants | Bulgaria | 99.9 /100 | #63 | Exceptional $51,318 |
| New Zealanders | 99.9 /100 | #64 | Exceptional $51,246 |
| Greeks | 99.9 /100 | #65 | Exceptional $51,164 |
| Afghans | 99.9 /100 | #66 | Exceptional $51,112 |
| Immigrants | Spain | 99.9 /100 | #67 | Exceptional $51,092 |
| Paraguayans | 99.9 /100 | #68 | Exceptional $51,068 |
| Mongolians | 99.8 /100 | #69 | Exceptional $51,038 |