Turkish vs Immigrants from Eastern Asia Median Family Income
COMPARE
Turkish
Immigrants from Eastern Asia
Median Family Income
Median Family Income Comparison
Turks
Immigrants from Eastern Asia
$121,202
MEDIAN FAMILY INCOME
100.0/ 100
METRIC RATING
25th/ 347
METRIC RANK
$125,150
MEDIAN FAMILY INCOME
100.0/ 100
METRIC RATING
18th/ 347
METRIC RANK
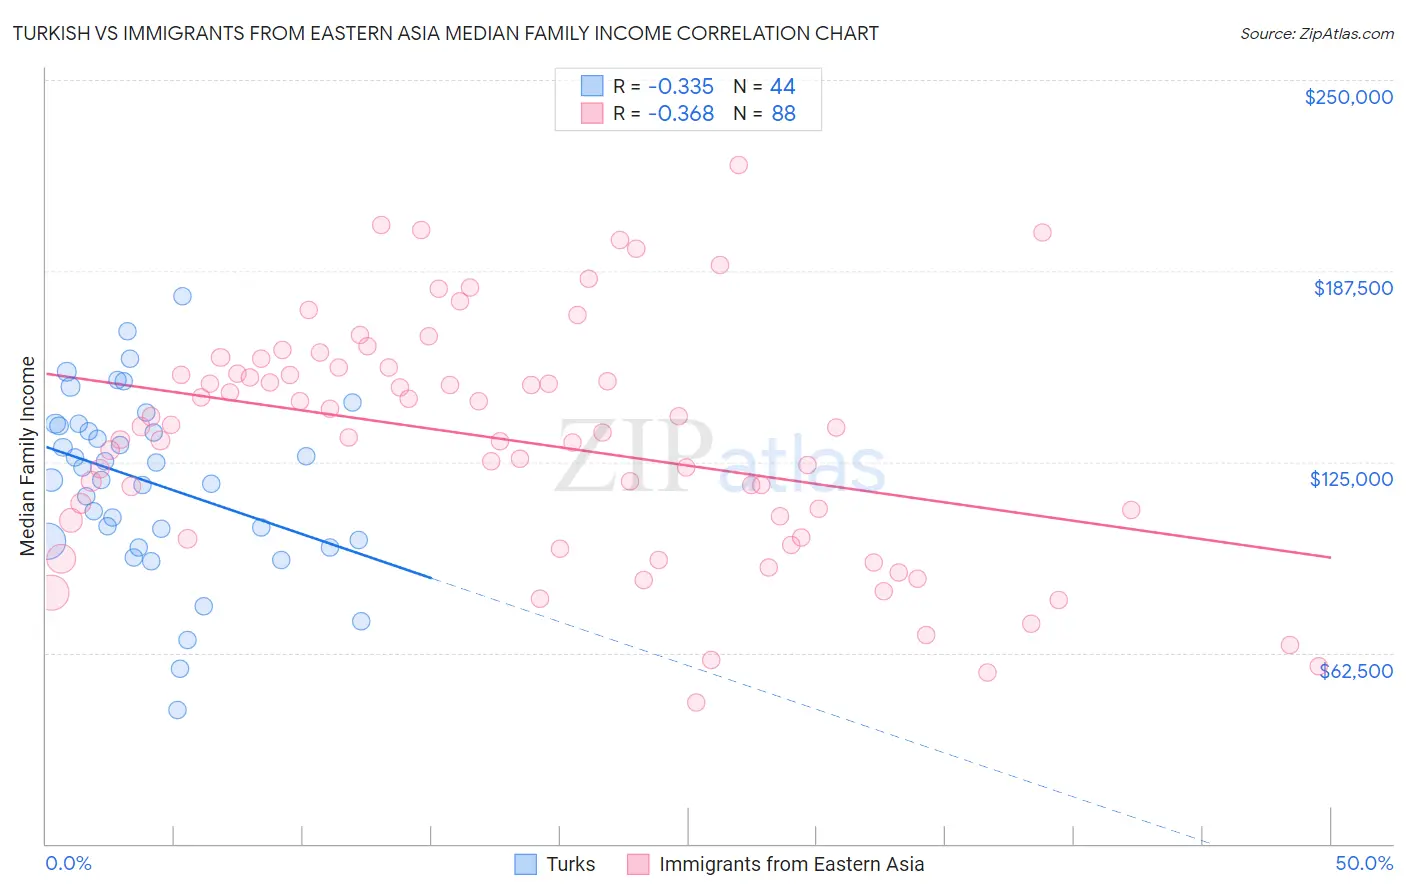
Turkish vs Immigrants from Eastern Asia Median Family Income Correlation Chart
The statistical analysis conducted on geographies consisting of 271,625,572 people shows a mild negative correlation between the proportion of Turks and median family income in the United States with a correlation coefficient (R) of -0.335 and weighted average of $121,202. Similarly, the statistical analysis conducted on geographies consisting of 499,115,176 people shows a mild negative correlation between the proportion of Immigrants from Eastern Asia and median family income in the United States with a correlation coefficient (R) of -0.368 and weighted average of $125,150, a difference of 3.3%.
Median Family Income Correlation Summary
| Measurement | Turkish | Immigrants from Eastern Asia |
| Minimum | $43,750 | $46,207 |
| Maximum | $179,091 | $222,159 |
| Range | $135,341 | $175,952 |
| Mean | $118,204 | $131,947 |
| Median | $121,237 | $135,368 |
| Interquartile 25% (IQ1) | $99,051 | $103,059 |
| Interquartile 75% (IQ3) | $137,062 | $154,860 |
| Interquartile Range (IQR) | $38,011 | $51,801 |
| Standard Deviation (Sample) | $28,920 | $38,302 |
| Standard Deviation (Population) | $28,590 | $38,084 |
Demographics Similar to Turks and Immigrants from Eastern Asia by Median Family Income
In terms of median family income, the demographic groups most similar to Turks are Immigrants from Switzerland ($120,726, a difference of 0.39%), Immigrants from Northern Europe ($121,840, a difference of 0.53%), Russian ($120,487, a difference of 0.59%), Immigrants from Denmark ($120,445, a difference of 0.63%), and Latvian ($120,301, a difference of 0.75%). Similarly, the demographic groups most similar to Immigrants from Eastern Asia are Indian (Asian) ($125,312, a difference of 0.13%), Immigrants from China ($125,540, a difference of 0.31%), Eastern European ($125,546, a difference of 0.32%), Immigrants from South Central Asia ($125,956, a difference of 0.64%), and Immigrants from Belgium ($123,831, a difference of 1.1%).
| Demographics | Rating | Rank | Median Family Income |
| Immigrants | Israel | 100.0 /100 | #11 | Exceptional $127,430 |
| Cypriots | 100.0 /100 | #12 | Exceptional $127,064 |
| Immigrants | Australia | 100.0 /100 | #13 | Exceptional $126,620 |
| Immigrants | South Central Asia | 100.0 /100 | #14 | Exceptional $125,956 |
| Eastern Europeans | 100.0 /100 | #15 | Exceptional $125,546 |
| Immigrants | China | 100.0 /100 | #16 | Exceptional $125,540 |
| Indians (Asian) | 100.0 /100 | #17 | Exceptional $125,312 |
| Immigrants | Eastern Asia | 100.0 /100 | #18 | Exceptional $125,150 |
| Immigrants | Belgium | 100.0 /100 | #19 | Exceptional $123,831 |
| Burmese | 100.0 /100 | #20 | Exceptional $123,369 |
| Immigrants | Korea | 100.0 /100 | #21 | Exceptional $122,800 |
| Immigrants | Sweden | 100.0 /100 | #22 | Exceptional $122,765 |
| Immigrants | Japan | 100.0 /100 | #23 | Exceptional $122,764 |
| Immigrants | Northern Europe | 100.0 /100 | #24 | Exceptional $121,840 |
| Turks | 100.0 /100 | #25 | Exceptional $121,202 |
| Immigrants | Switzerland | 100.0 /100 | #26 | Exceptional $120,726 |
| Russians | 100.0 /100 | #27 | Exceptional $120,487 |
| Immigrants | Denmark | 100.0 /100 | #28 | Exceptional $120,445 |
| Latvians | 100.0 /100 | #29 | Exceptional $120,301 |
| Immigrants | Sri Lanka | 100.0 /100 | #30 | Exceptional $120,263 |
| Immigrants | France | 100.0 /100 | #31 | Exceptional $120,076 |