Marshallese vs Russian Per Capita Income
COMPARE
Marshallese
Russian
Per Capita Income
Per Capita Income Comparison
Marshallese
Russians
$39,108
PER CAPITA INCOME
0.6/ 100
METRIC RATING
261st/ 347
METRIC RANK
$53,154
PER CAPITA INCOME
100.0/ 100
METRIC RATING
26th/ 347
METRIC RANK
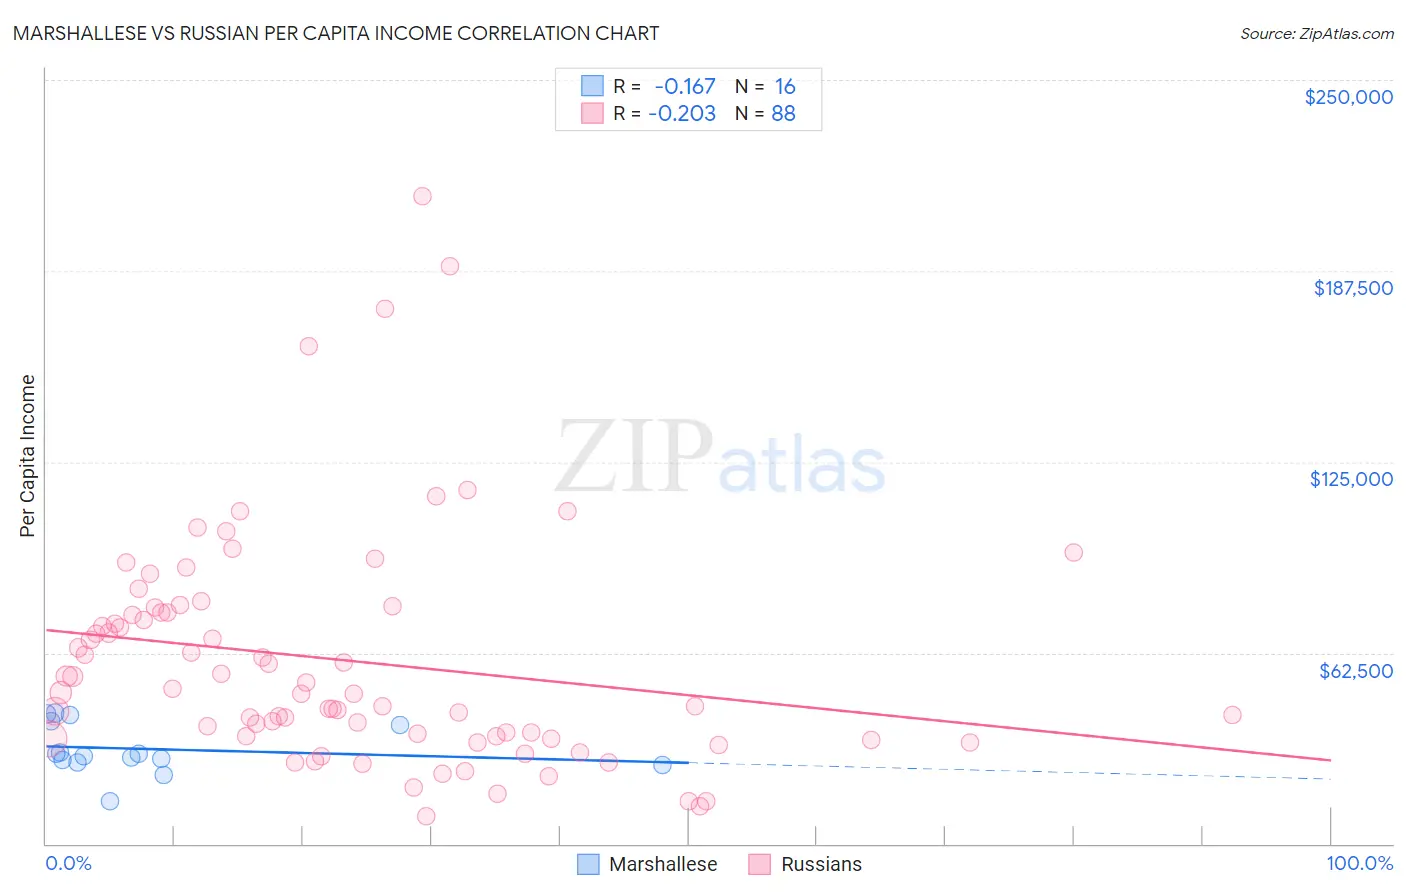
Marshallese vs Russian Per Capita Income Correlation Chart
The statistical analysis conducted on geographies consisting of 14,761,315 people shows a poor negative correlation between the proportion of Marshallese and per capita income in the United States with a correlation coefficient (R) of -0.167 and weighted average of $39,108. Similarly, the statistical analysis conducted on geographies consisting of 512,304,099 people shows a weak negative correlation between the proportion of Russians and per capita income in the United States with a correlation coefficient (R) of -0.203 and weighted average of $53,154, a difference of 35.9%.
Per Capita Income Correlation Summary
| Measurement | Marshallese | Russian |
| Minimum | $14,082 | $9,193 |
| Maximum | $42,763 | $212,036 |
| Range | $28,681 | $202,843 |
| Mean | $31,016 | $59,937 |
| Median | $29,047 | $49,383 |
| Interquartile 25% (IQ1) | $26,970 | $34,688 |
| Interquartile 75% (IQ3) | $39,382 | $75,613 |
| Interquartile Range (IQR) | $12,413 | $40,926 |
| Standard Deviation (Sample) | $8,089 | $37,845 |
| Standard Deviation (Population) | $7,833 | $37,630 |
Similar Demographics by Per Capita Income
Demographics Similar to Marshallese by Per Capita Income
In terms of per capita income, the demographic groups most similar to Marshallese are Iroquois ($39,104, a difference of 0.010%), Belizean ($39,097, a difference of 0.030%), Alaskan Athabascan ($39,163, a difference of 0.14%), American ($39,039, a difference of 0.17%), and Malaysian ($39,194, a difference of 0.22%).
| Demographics | Rating | Rank | Per Capita Income |
| Alaska Natives | 1.0 /100 | #254 | Tragic $39,558 |
| Immigrants | Middle Africa | 1.0 /100 | #255 | Tragic $39,529 |
| Hawaiians | 0.8 /100 | #256 | Tragic $39,403 |
| Nicaraguans | 0.8 /100 | #257 | Tragic $39,372 |
| Jamaicans | 0.7 /100 | #258 | Tragic $39,231 |
| Malaysians | 0.7 /100 | #259 | Tragic $39,194 |
| Alaskan Athabascans | 0.6 /100 | #260 | Tragic $39,163 |
| Marshallese | 0.6 /100 | #261 | Tragic $39,108 |
| Iroquois | 0.6 /100 | #262 | Tragic $39,104 |
| Belizeans | 0.6 /100 | #263 | Tragic $39,097 |
| Americans | 0.6 /100 | #264 | Tragic $39,039 |
| Spanish Americans | 0.5 /100 | #265 | Tragic $39,012 |
| Salvadorans | 0.5 /100 | #266 | Tragic $38,858 |
| Immigrants | Zaire | 0.4 /100 | #267 | Tragic $38,848 |
| Liberians | 0.4 /100 | #268 | Tragic $38,780 |
Demographics Similar to Russians by Per Capita Income
In terms of per capita income, the demographic groups most similar to Russians are Immigrants from Japan ($53,359, a difference of 0.39%), Immigrants from South Central Asia ($52,660, a difference of 0.94%), Latvian ($52,649, a difference of 0.96%), Israeli ($52,596, a difference of 1.1%), and Immigrants from Denmark ($53,799, a difference of 1.2%).
| Demographics | Rating | Rank | Per Capita Income |
| Immigrants | China | 100.0 /100 | #19 | Exceptional $54,264 |
| Soviet Union | 100.0 /100 | #20 | Exceptional $54,202 |
| Immigrants | Northern Europe | 100.0 /100 | #21 | Exceptional $54,159 |
| Indians (Asian) | 100.0 /100 | #22 | Exceptional $53,874 |
| Immigrants | Eastern Asia | 100.0 /100 | #23 | Exceptional $53,806 |
| Immigrants | Denmark | 100.0 /100 | #24 | Exceptional $53,799 |
| Immigrants | Japan | 100.0 /100 | #25 | Exceptional $53,359 |
| Russians | 100.0 /100 | #26 | Exceptional $53,154 |
| Immigrants | South Central Asia | 100.0 /100 | #27 | Exceptional $52,660 |
| Latvians | 100.0 /100 | #28 | Exceptional $52,649 |
| Israelis | 100.0 /100 | #29 | Exceptional $52,596 |
| Immigrants | Austria | 100.0 /100 | #30 | Exceptional $52,503 |
| Turks | 100.0 /100 | #31 | Exceptional $52,391 |
| Immigrants | Norway | 100.0 /100 | #32 | Exceptional $52,217 |
| Australians | 100.0 /100 | #33 | Exceptional $52,074 |