Marshallese vs Immigrants from Malaysia Per Capita Income
COMPARE
Marshallese
Immigrants from Malaysia
Per Capita Income
Per Capita Income Comparison
Marshallese
Immigrants from Malaysia
$39,108
PER CAPITA INCOME
0.6/ 100
METRIC RATING
261st/ 347
METRIC RANK
$49,983
PER CAPITA INCOME
99.9/ 100
METRIC RATING
58th/ 347
METRIC RANK
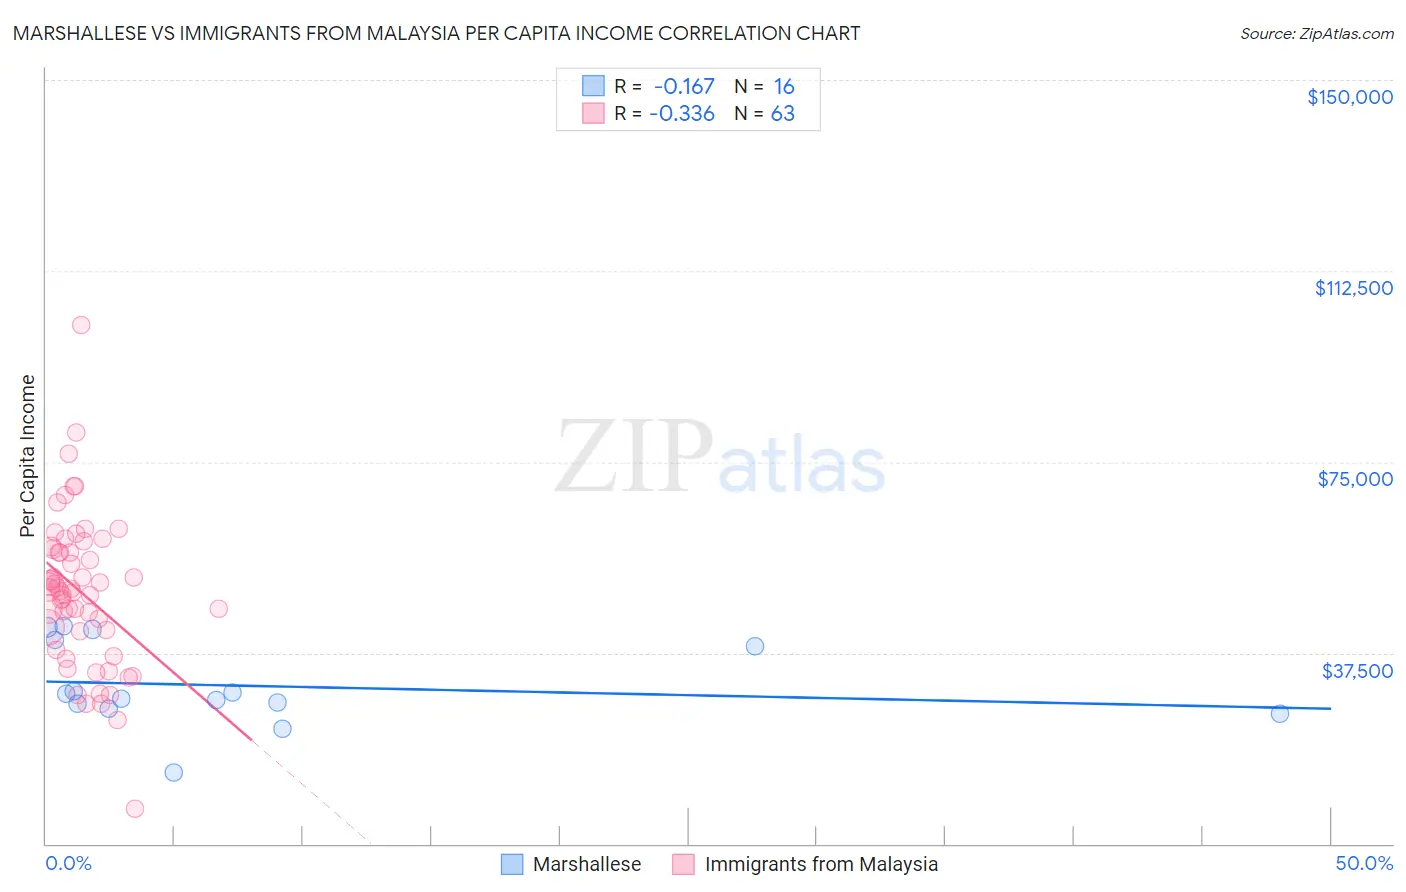
Marshallese vs Immigrants from Malaysia Per Capita Income Correlation Chart
The statistical analysis conducted on geographies consisting of 14,761,315 people shows a poor negative correlation between the proportion of Marshallese and per capita income in the United States with a correlation coefficient (R) of -0.167 and weighted average of $39,108. Similarly, the statistical analysis conducted on geographies consisting of 197,965,011 people shows a mild negative correlation between the proportion of Immigrants from Malaysia and per capita income in the United States with a correlation coefficient (R) of -0.336 and weighted average of $49,983, a difference of 27.8%.
Per Capita Income Correlation Summary
| Measurement | Marshallese | Immigrants from Malaysia |
| Minimum | $14,082 | $6,770 |
| Maximum | $42,763 | $101,760 |
| Range | $28,681 | $94,990 |
| Mean | $31,016 | $49,426 |
| Median | $29,047 | $49,924 |
| Interquartile 25% (IQ1) | $26,970 | $41,735 |
| Interquartile 75% (IQ3) | $39,382 | $57,884 |
| Interquartile Range (IQR) | $12,413 | $16,150 |
| Standard Deviation (Sample) | $8,089 | $15,009 |
| Standard Deviation (Population) | $7,833 | $14,890 |
Similar Demographics by Per Capita Income
Demographics Similar to Marshallese by Per Capita Income
In terms of per capita income, the demographic groups most similar to Marshallese are Iroquois ($39,104, a difference of 0.010%), Belizean ($39,097, a difference of 0.030%), Alaskan Athabascan ($39,163, a difference of 0.14%), American ($39,039, a difference of 0.17%), and Malaysian ($39,194, a difference of 0.22%).
| Demographics | Rating | Rank | Per Capita Income |
| Alaska Natives | 1.0 /100 | #254 | Tragic $39,558 |
| Immigrants | Middle Africa | 1.0 /100 | #255 | Tragic $39,529 |
| Hawaiians | 0.8 /100 | #256 | Tragic $39,403 |
| Nicaraguans | 0.8 /100 | #257 | Tragic $39,372 |
| Jamaicans | 0.7 /100 | #258 | Tragic $39,231 |
| Malaysians | 0.7 /100 | #259 | Tragic $39,194 |
| Alaskan Athabascans | 0.6 /100 | #260 | Tragic $39,163 |
| Marshallese | 0.6 /100 | #261 | Tragic $39,108 |
| Iroquois | 0.6 /100 | #262 | Tragic $39,104 |
| Belizeans | 0.6 /100 | #263 | Tragic $39,097 |
| Americans | 0.6 /100 | #264 | Tragic $39,039 |
| Spanish Americans | 0.5 /100 | #265 | Tragic $39,012 |
| Salvadorans | 0.5 /100 | #266 | Tragic $38,858 |
| Immigrants | Zaire | 0.4 /100 | #267 | Tragic $38,848 |
| Liberians | 0.4 /100 | #268 | Tragic $38,780 |
Demographics Similar to Immigrants from Malaysia by Per Capita Income
In terms of per capita income, the demographic groups most similar to Immigrants from Malaysia are South African ($50,044, a difference of 0.12%), Asian ($50,057, a difference of 0.15%), Immigrants from Western Europe ($50,065, a difference of 0.16%), Bhutanese ($49,894, a difference of 0.18%), and Immigrants from Scotland ($49,893, a difference of 0.18%).
| Demographics | Rating | Rank | Per Capita Income |
| Immigrants | Netherlands | 100.0 /100 | #51 | Exceptional $50,458 |
| Immigrants | Croatia | 99.9 /100 | #52 | Exceptional $50,417 |
| Paraguayans | 99.9 /100 | #53 | Exceptional $50,385 |
| Immigrants | Belarus | 99.9 /100 | #54 | Exceptional $50,303 |
| Immigrants | Western Europe | 99.9 /100 | #55 | Exceptional $50,065 |
| Asians | 99.9 /100 | #56 | Exceptional $50,057 |
| South Africans | 99.9 /100 | #57 | Exceptional $50,044 |
| Immigrants | Malaysia | 99.9 /100 | #58 | Exceptional $49,983 |
| Bhutanese | 99.9 /100 | #59 | Exceptional $49,894 |
| Immigrants | Scotland | 99.9 /100 | #60 | Exceptional $49,893 |
| Argentineans | 99.9 /100 | #61 | Exceptional $49,862 |
| Immigrants | Asia | 99.9 /100 | #62 | Exceptional $49,741 |
| Maltese | 99.9 /100 | #63 | Exceptional $49,640 |
| Immigrants | Argentina | 99.9 /100 | #64 | Exceptional $49,627 |
| Bolivians | 99.9 /100 | #65 | Exceptional $49,526 |