Marshallese vs Immigrants from Guatemala Per Capita Income
COMPARE
Marshallese
Immigrants from Guatemala
Per Capita Income
Per Capita Income Comparison
Marshallese
Immigrants from Guatemala
$39,108
PER CAPITA INCOME
0.6/ 100
METRIC RATING
261st/ 347
METRIC RANK
$37,550
PER CAPITA INCOME
0.1/ 100
METRIC RATING
290th/ 347
METRIC RANK
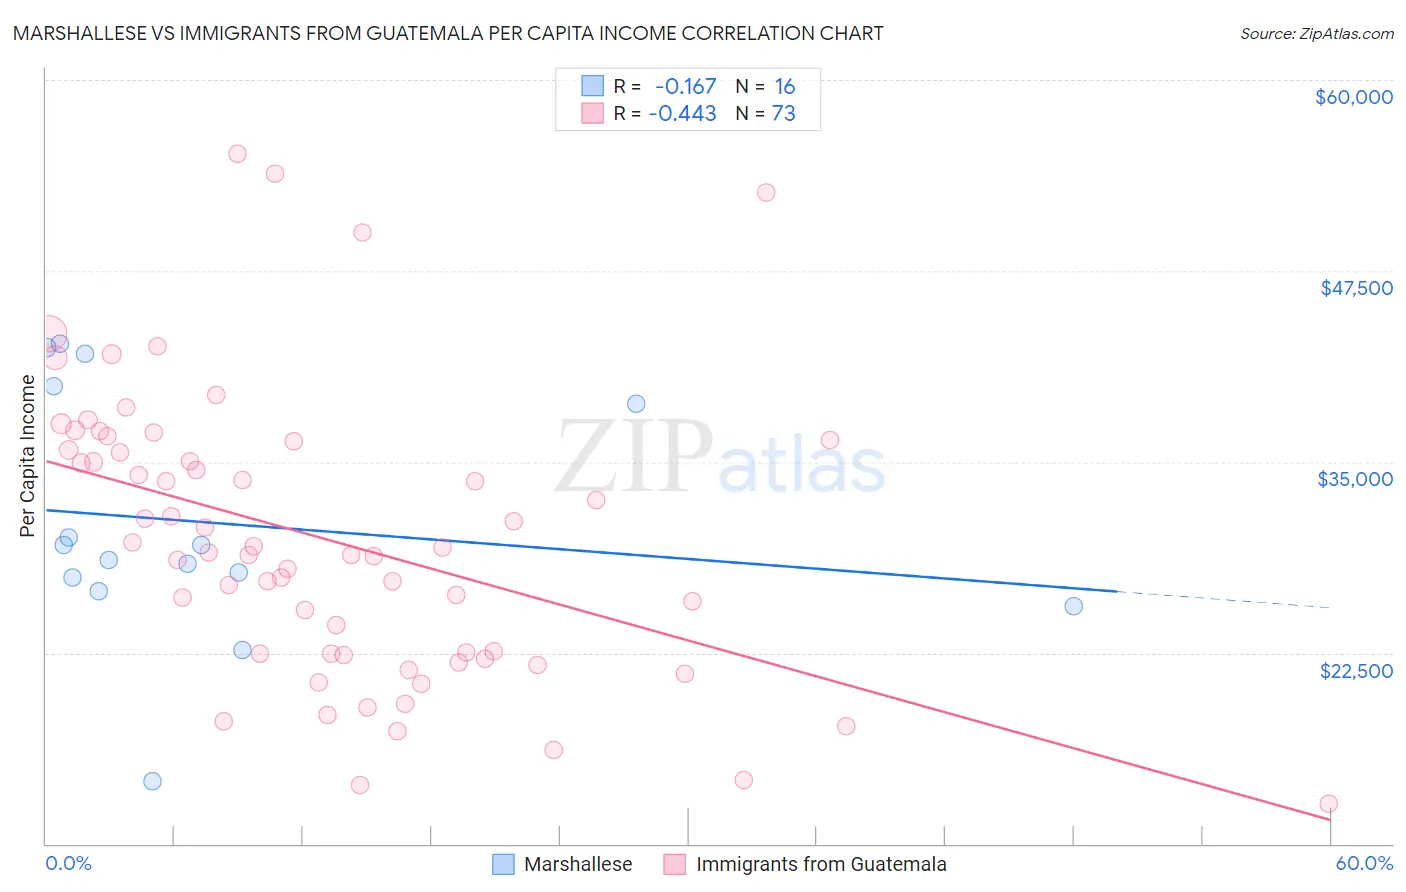
Marshallese vs Immigrants from Guatemala Per Capita Income Correlation Chart
The statistical analysis conducted on geographies consisting of 14,761,315 people shows a poor negative correlation between the proportion of Marshallese and per capita income in the United States with a correlation coefficient (R) of -0.167 and weighted average of $39,108. Similarly, the statistical analysis conducted on geographies consisting of 377,292,357 people shows a moderate negative correlation between the proportion of Immigrants from Guatemala and per capita income in the United States with a correlation coefficient (R) of -0.443 and weighted average of $37,550, a difference of 4.2%.
Per Capita Income Correlation Summary
| Measurement | Marshallese | Immigrants from Guatemala |
| Minimum | $14,082 | $12,606 |
| Maximum | $42,763 | $55,157 |
| Range | $28,681 | $42,551 |
| Mean | $31,016 | $29,919 |
| Median | $29,047 | $29,061 |
| Interquartile 25% (IQ1) | $26,970 | $22,369 |
| Interquartile 75% (IQ3) | $39,382 | $36,058 |
| Interquartile Range (IQR) | $12,413 | $13,690 |
| Standard Deviation (Sample) | $8,089 | $9,360 |
| Standard Deviation (Population) | $7,833 | $9,296 |
Similar Demographics by Per Capita Income
Demographics Similar to Marshallese by Per Capita Income
In terms of per capita income, the demographic groups most similar to Marshallese are Iroquois ($39,104, a difference of 0.010%), Belizean ($39,097, a difference of 0.030%), Alaskan Athabascan ($39,163, a difference of 0.14%), American ($39,039, a difference of 0.17%), and Malaysian ($39,194, a difference of 0.22%).
| Demographics | Rating | Rank | Per Capita Income |
| Alaska Natives | 1.0 /100 | #254 | Tragic $39,558 |
| Immigrants | Middle Africa | 1.0 /100 | #255 | Tragic $39,529 |
| Hawaiians | 0.8 /100 | #256 | Tragic $39,403 |
| Nicaraguans | 0.8 /100 | #257 | Tragic $39,372 |
| Jamaicans | 0.7 /100 | #258 | Tragic $39,231 |
| Malaysians | 0.7 /100 | #259 | Tragic $39,194 |
| Alaskan Athabascans | 0.6 /100 | #260 | Tragic $39,163 |
| Marshallese | 0.6 /100 | #261 | Tragic $39,108 |
| Iroquois | 0.6 /100 | #262 | Tragic $39,104 |
| Belizeans | 0.6 /100 | #263 | Tragic $39,097 |
| Americans | 0.6 /100 | #264 | Tragic $39,039 |
| Spanish Americans | 0.5 /100 | #265 | Tragic $39,012 |
| Salvadorans | 0.5 /100 | #266 | Tragic $38,858 |
| Immigrants | Zaire | 0.4 /100 | #267 | Tragic $38,848 |
| Liberians | 0.4 /100 | #268 | Tragic $38,780 |
Demographics Similar to Immigrants from Guatemala by Per Capita Income
In terms of per capita income, the demographic groups most similar to Immigrants from Guatemala are Cajun ($37,527, a difference of 0.060%), U.S. Virgin Islander ($37,589, a difference of 0.10%), Immigrants from Micronesia ($37,464, a difference of 0.23%), Mexican American Indian ($37,407, a difference of 0.38%), and Dominican ($37,697, a difference of 0.39%).
| Demographics | Rating | Rank | Per Capita Income |
| Pennsylvania Germans | 0.1 /100 | #283 | Tragic $37,842 |
| Africans | 0.1 /100 | #284 | Tragic $37,785 |
| Guatemalans | 0.1 /100 | #285 | Tragic $37,766 |
| Central American Indians | 0.1 /100 | #286 | Tragic $37,699 |
| Dominicans | 0.1 /100 | #287 | Tragic $37,697 |
| Blackfeet | 0.1 /100 | #288 | Tragic $37,695 |
| U.S. Virgin Islanders | 0.1 /100 | #289 | Tragic $37,589 |
| Immigrants | Guatemala | 0.1 /100 | #290 | Tragic $37,550 |
| Cajuns | 0.1 /100 | #291 | Tragic $37,527 |
| Immigrants | Micronesia | 0.1 /100 | #292 | Tragic $37,464 |
| Mexican American Indians | 0.1 /100 | #293 | Tragic $37,407 |
| Cubans | 0.1 /100 | #294 | Tragic $37,383 |
| Immigrants | Dominican Republic | 0.1 /100 | #295 | Tragic $37,306 |
| Indonesians | 0.1 /100 | #296 | Tragic $37,300 |
| Haitians | 0.1 /100 | #297 | Tragic $37,289 |