Malaysian vs Immigrants from Nigeria Per Capita Income
COMPARE
Malaysian
Immigrants from Nigeria
Per Capita Income
Per Capita Income Comparison
Malaysians
Immigrants from Nigeria
$39,194
PER CAPITA INCOME
0.7/ 100
METRIC RATING
259th/ 347
METRIC RANK
$40,339
PER CAPITA INCOME
2.3/ 100
METRIC RATING
240th/ 347
METRIC RANK
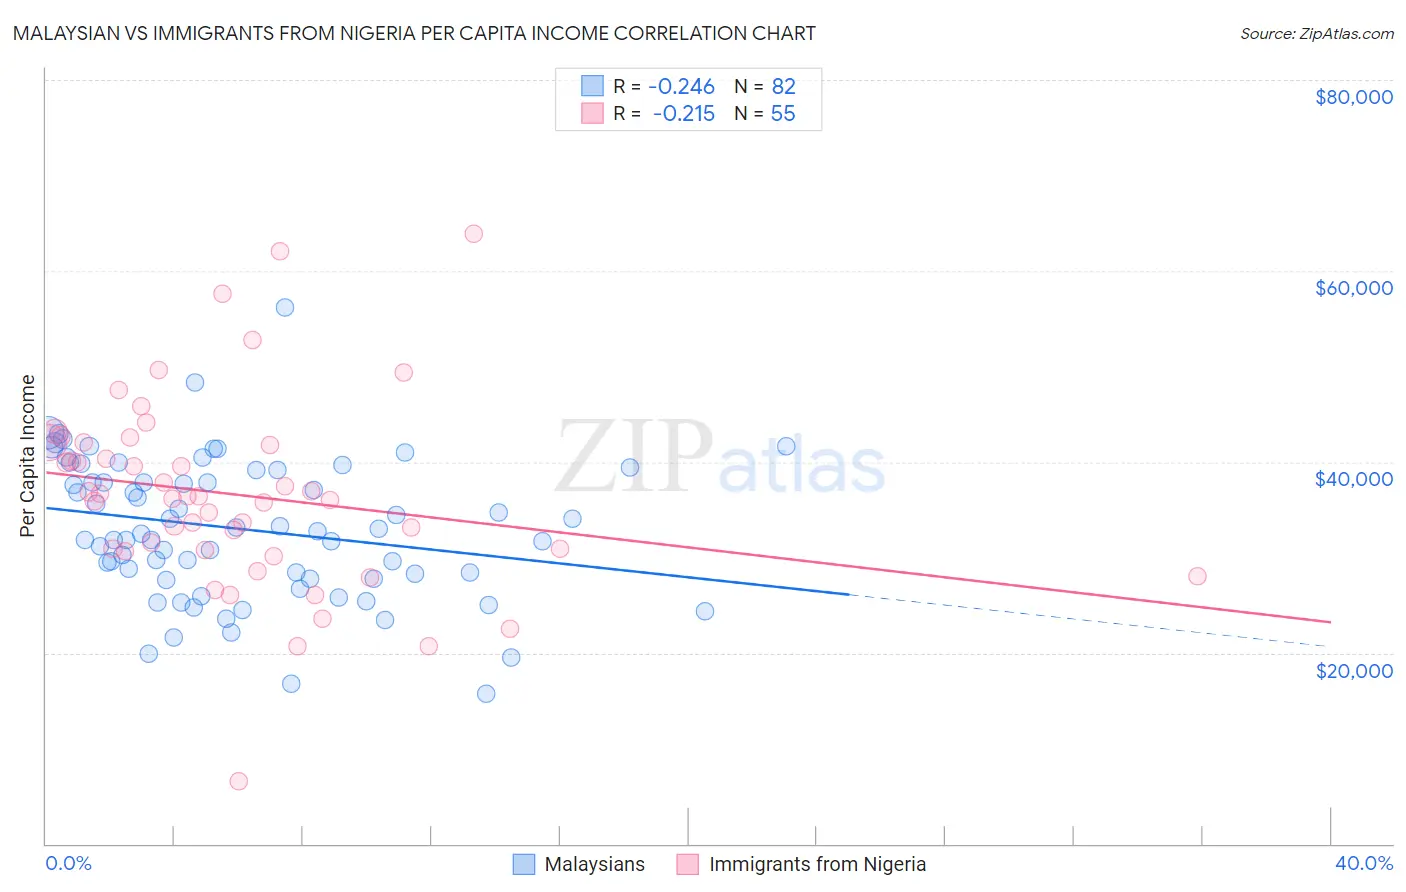
Malaysian vs Immigrants from Nigeria Per Capita Income Correlation Chart
The statistical analysis conducted on geographies consisting of 226,115,655 people shows a weak negative correlation between the proportion of Malaysians and per capita income in the United States with a correlation coefficient (R) of -0.246 and weighted average of $39,194. Similarly, the statistical analysis conducted on geographies consisting of 283,501,932 people shows a weak negative correlation between the proportion of Immigrants from Nigeria and per capita income in the United States with a correlation coefficient (R) of -0.215 and weighted average of $40,339, a difference of 2.9%.
Per Capita Income Correlation Summary
| Measurement | Malaysian | Immigrants from Nigeria |
| Minimum | $15,753 | $6,524 |
| Maximum | $56,163 | $63,917 |
| Range | $40,410 | $57,393 |
| Mean | $32,947 | $36,581 |
| Median | $32,625 | $36,394 |
| Interquartile 25% (IQ1) | $27,821 | $30,744 |
| Interquartile 75% (IQ3) | $39,160 | $42,001 |
| Interquartile Range (IQR) | $11,339 | $11,256 |
| Standard Deviation (Sample) | $7,360 | $10,124 |
| Standard Deviation (Population) | $7,315 | $10,032 |
Demographics Similar to Malaysians and Immigrants from Nigeria by Per Capita Income
In terms of per capita income, the demographic groups most similar to Malaysians are Jamaican ($39,231, a difference of 0.090%), Nicaraguan ($39,372, a difference of 0.46%), Hawaiian ($39,403, a difference of 0.53%), Immigrants from Middle Africa ($39,529, a difference of 0.85%), and Alaska Native ($39,558, a difference of 0.93%). Similarly, the demographic groups most similar to Immigrants from Nigeria are Tsimshian ($40,344, a difference of 0.010%), British West Indian ($40,330, a difference of 0.020%), Immigrants from Western Africa ($40,294, a difference of 0.11%), German Russian ($40,266, a difference of 0.18%), and French American Indian ($40,244, a difference of 0.24%).
| Demographics | Rating | Rank | Per Capita Income |
| Tsimshian | 2.4 /100 | #239 | Tragic $40,344 |
| Immigrants | Nigeria | 2.3 /100 | #240 | Tragic $40,339 |
| British West Indians | 2.3 /100 | #241 | Tragic $40,330 |
| Immigrants | Western Africa | 2.2 /100 | #242 | Tragic $40,294 |
| German Russians | 2.2 /100 | #243 | Tragic $40,266 |
| French American Indians | 2.1 /100 | #244 | Tragic $40,244 |
| Sub-Saharan Africans | 1.9 /100 | #245 | Tragic $40,152 |
| Cree | 1.7 /100 | #246 | Tragic $40,056 |
| Immigrants | Somalia | 1.6 /100 | #247 | Tragic $39,974 |
| Cape Verdeans | 1.5 /100 | #248 | Tragic $39,935 |
| Japanese | 1.4 /100 | #249 | Tragic $39,870 |
| Immigrants | Burma/Myanmar | 1.3 /100 | #250 | Tragic $39,827 |
| Samoans | 1.3 /100 | #251 | Tragic $39,826 |
| Immigrants | Azores | 1.0 /100 | #252 | Tragic $39,608 |
| Osage | 1.0 /100 | #253 | Tragic $39,568 |
| Alaska Natives | 1.0 /100 | #254 | Tragic $39,558 |
| Immigrants | Middle Africa | 1.0 /100 | #255 | Tragic $39,529 |
| Hawaiians | 0.8 /100 | #256 | Tragic $39,403 |
| Nicaraguans | 0.8 /100 | #257 | Tragic $39,372 |
| Jamaicans | 0.7 /100 | #258 | Tragic $39,231 |
| Malaysians | 0.7 /100 | #259 | Tragic $39,194 |