Malaysian vs Immigrants from Albania Per Capita Income
COMPARE
Malaysian
Immigrants from Albania
Per Capita Income
Per Capita Income Comparison
Malaysians
Immigrants from Albania
$39,194
PER CAPITA INCOME
0.7/ 100
METRIC RATING
259th/ 347
METRIC RANK
$46,387
PER CAPITA INCOME
95.5/ 100
METRIC RATING
113th/ 347
METRIC RANK
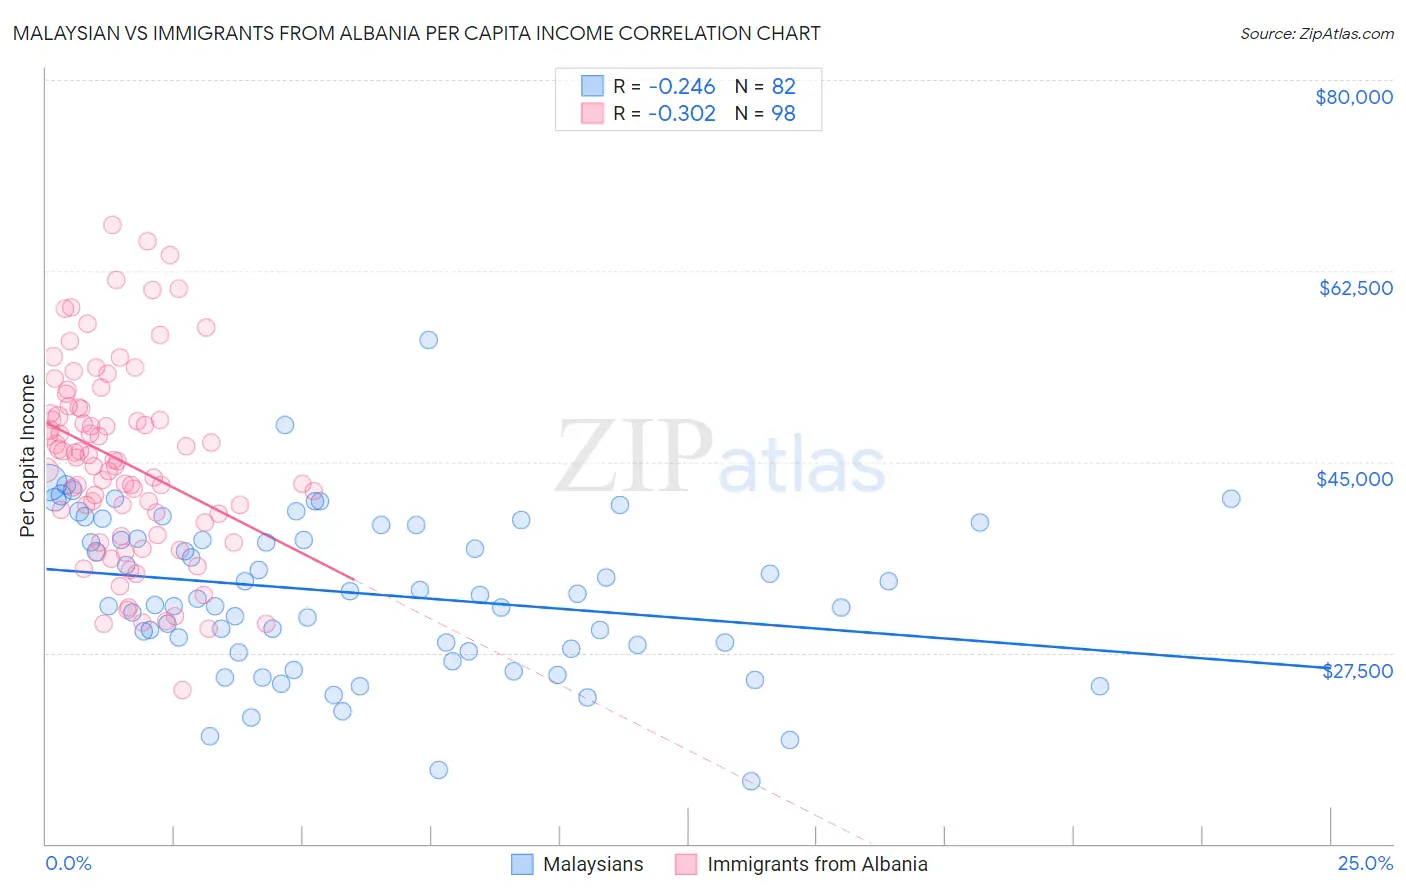
Malaysian vs Immigrants from Albania Per Capita Income Correlation Chart
The statistical analysis conducted on geographies consisting of 226,115,655 people shows a weak negative correlation between the proportion of Malaysians and per capita income in the United States with a correlation coefficient (R) of -0.246 and weighted average of $39,194. Similarly, the statistical analysis conducted on geographies consisting of 119,376,608 people shows a mild negative correlation between the proportion of Immigrants from Albania and per capita income in the United States with a correlation coefficient (R) of -0.302 and weighted average of $46,387, a difference of 18.3%.
Per Capita Income Correlation Summary
| Measurement | Malaysian | Immigrants from Albania |
| Minimum | $15,753 | $24,123 |
| Maximum | $56,163 | $66,738 |
| Range | $40,410 | $42,615 |
| Mean | $32,947 | $45,029 |
| Median | $32,625 | $45,153 |
| Interquartile 25% (IQ1) | $27,821 | $39,496 |
| Interquartile 75% (IQ3) | $39,160 | $49,916 |
| Interquartile Range (IQR) | $11,339 | $10,420 |
| Standard Deviation (Sample) | $7,360 | $8,753 |
| Standard Deviation (Population) | $7,315 | $8,708 |
Similar Demographics by Per Capita Income
Demographics Similar to Malaysians by Per Capita Income
In terms of per capita income, the demographic groups most similar to Malaysians are Alaskan Athabascan ($39,163, a difference of 0.080%), Jamaican ($39,231, a difference of 0.090%), Marshallese ($39,108, a difference of 0.22%), Iroquois ($39,104, a difference of 0.23%), and Belizean ($39,097, a difference of 0.25%).
| Demographics | Rating | Rank | Per Capita Income |
| Immigrants | Azores | 1.0 /100 | #252 | Tragic $39,608 |
| Osage | 1.0 /100 | #253 | Tragic $39,568 |
| Alaska Natives | 1.0 /100 | #254 | Tragic $39,558 |
| Immigrants | Middle Africa | 1.0 /100 | #255 | Tragic $39,529 |
| Hawaiians | 0.8 /100 | #256 | Tragic $39,403 |
| Nicaraguans | 0.8 /100 | #257 | Tragic $39,372 |
| Jamaicans | 0.7 /100 | #258 | Tragic $39,231 |
| Malaysians | 0.7 /100 | #259 | Tragic $39,194 |
| Alaskan Athabascans | 0.6 /100 | #260 | Tragic $39,163 |
| Marshallese | 0.6 /100 | #261 | Tragic $39,108 |
| Iroquois | 0.6 /100 | #262 | Tragic $39,104 |
| Belizeans | 0.6 /100 | #263 | Tragic $39,097 |
| Americans | 0.6 /100 | #264 | Tragic $39,039 |
| Spanish Americans | 0.5 /100 | #265 | Tragic $39,012 |
| Salvadorans | 0.5 /100 | #266 | Tragic $38,858 |
Demographics Similar to Immigrants from Albania by Per Capita Income
In terms of per capita income, the demographic groups most similar to Immigrants from Albania are Immigrants from Morocco ($46,430, a difference of 0.090%), Taiwanese ($46,455, a difference of 0.14%), Chilean ($46,459, a difference of 0.15%), Afghan ($46,268, a difference of 0.26%), and Immigrants from Northern Africa ($46,531, a difference of 0.31%).
| Demographics | Rating | Rank | Per Capita Income |
| Ethiopians | 96.3 /100 | #106 | Exceptional $46,569 |
| Serbians | 96.2 /100 | #107 | Exceptional $46,551 |
| Immigrants | Kuwait | 96.2 /100 | #108 | Exceptional $46,543 |
| Immigrants | Northern Africa | 96.2 /100 | #109 | Exceptional $46,531 |
| Chileans | 95.9 /100 | #110 | Exceptional $46,459 |
| Taiwanese | 95.8 /100 | #111 | Exceptional $46,455 |
| Immigrants | Morocco | 95.7 /100 | #112 | Exceptional $46,430 |
| Immigrants | Albania | 95.5 /100 | #113 | Exceptional $46,387 |
| Afghans | 94.9 /100 | #114 | Exceptional $46,268 |
| Immigrants | Chile | 94.6 /100 | #115 | Exceptional $46,213 |
| Poles | 94.1 /100 | #116 | Exceptional $46,123 |
| Chinese | 93.9 /100 | #117 | Exceptional $46,098 |
| Immigrants | Saudi Arabia | 93.3 /100 | #118 | Exceptional $46,008 |
| Immigrants | Poland | 93.1 /100 | #119 | Exceptional $45,979 |
| Immigrants | Ethiopia | 92.7 /100 | #120 | Exceptional $45,923 |