Malaysian vs Immigrants from Dominican Republic Per Capita Income
COMPARE
Malaysian
Immigrants from Dominican Republic
Per Capita Income
Per Capita Income Comparison
Malaysians
Immigrants from Dominican Republic
$39,194
PER CAPITA INCOME
0.7/ 100
METRIC RATING
259th/ 347
METRIC RANK
$37,306
PER CAPITA INCOME
0.1/ 100
METRIC RATING
295th/ 347
METRIC RANK
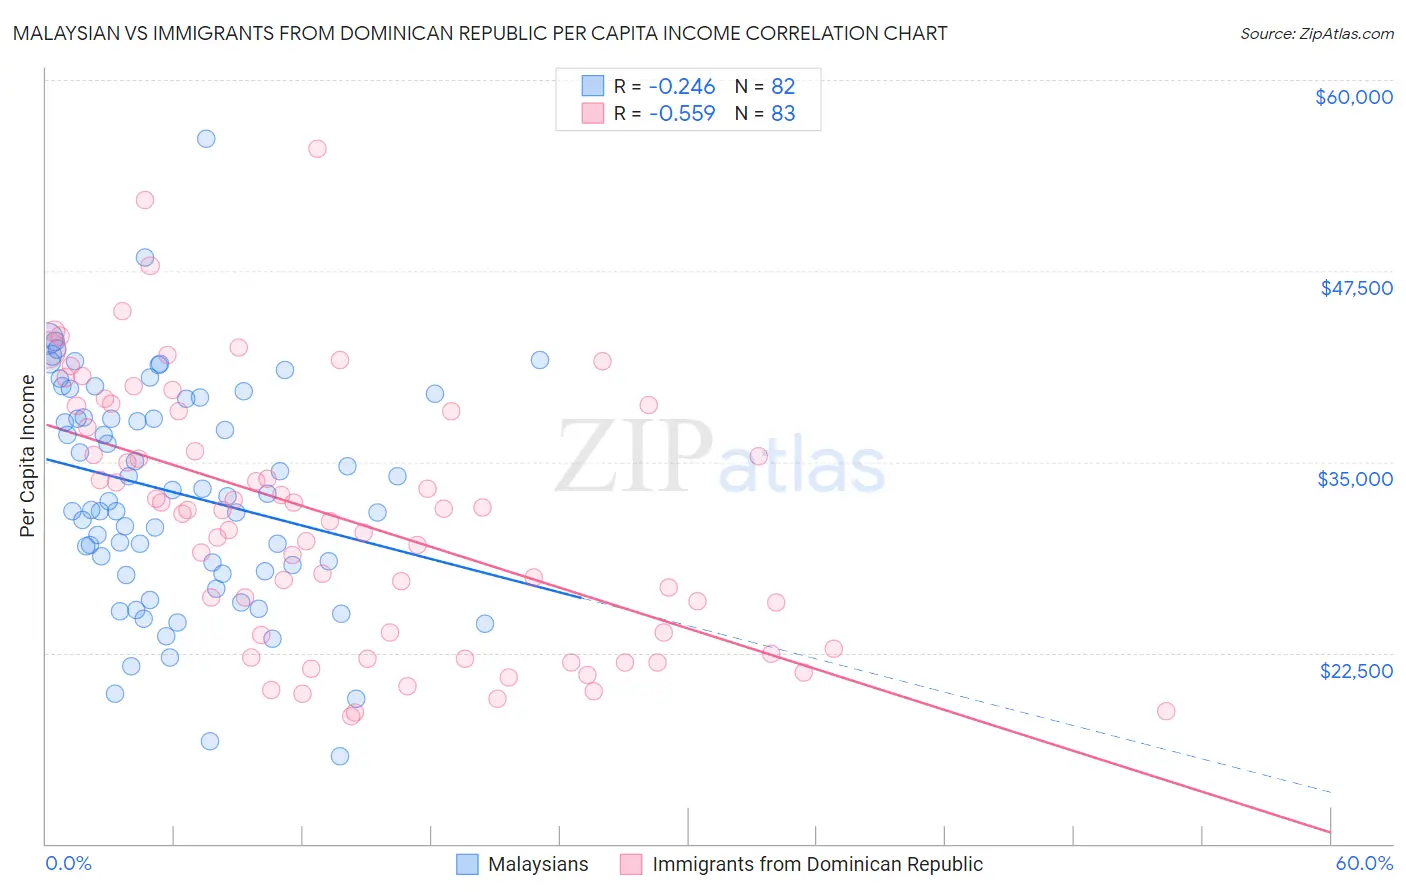
Malaysian vs Immigrants from Dominican Republic Per Capita Income Correlation Chart
The statistical analysis conducted on geographies consisting of 226,115,655 people shows a weak negative correlation between the proportion of Malaysians and per capita income in the United States with a correlation coefficient (R) of -0.246 and weighted average of $39,194. Similarly, the statistical analysis conducted on geographies consisting of 275,145,161 people shows a substantial negative correlation between the proportion of Immigrants from Dominican Republic and per capita income in the United States with a correlation coefficient (R) of -0.559 and weighted average of $37,306, a difference of 5.1%.
Per Capita Income Correlation Summary
| Measurement | Malaysian | Immigrants from Dominican Republic |
| Minimum | $15,753 | $18,351 |
| Maximum | $56,163 | $55,513 |
| Range | $40,410 | $37,162 |
| Mean | $32,947 | $31,368 |
| Median | $32,625 | $31,841 |
| Interquartile 25% (IQ1) | $27,821 | $23,631 |
| Interquartile 75% (IQ3) | $39,160 | $38,333 |
| Interquartile Range (IQR) | $11,339 | $14,702 |
| Standard Deviation (Sample) | $7,360 | $8,445 |
| Standard Deviation (Population) | $7,315 | $8,394 |
Similar Demographics by Per Capita Income
Demographics Similar to Malaysians by Per Capita Income
In terms of per capita income, the demographic groups most similar to Malaysians are Alaskan Athabascan ($39,163, a difference of 0.080%), Jamaican ($39,231, a difference of 0.090%), Marshallese ($39,108, a difference of 0.22%), Iroquois ($39,104, a difference of 0.23%), and Belizean ($39,097, a difference of 0.25%).
| Demographics | Rating | Rank | Per Capita Income |
| Immigrants | Azores | 1.0 /100 | #252 | Tragic $39,608 |
| Osage | 1.0 /100 | #253 | Tragic $39,568 |
| Alaska Natives | 1.0 /100 | #254 | Tragic $39,558 |
| Immigrants | Middle Africa | 1.0 /100 | #255 | Tragic $39,529 |
| Hawaiians | 0.8 /100 | #256 | Tragic $39,403 |
| Nicaraguans | 0.8 /100 | #257 | Tragic $39,372 |
| Jamaicans | 0.7 /100 | #258 | Tragic $39,231 |
| Malaysians | 0.7 /100 | #259 | Tragic $39,194 |
| Alaskan Athabascans | 0.6 /100 | #260 | Tragic $39,163 |
| Marshallese | 0.6 /100 | #261 | Tragic $39,108 |
| Iroquois | 0.6 /100 | #262 | Tragic $39,104 |
| Belizeans | 0.6 /100 | #263 | Tragic $39,097 |
| Americans | 0.6 /100 | #264 | Tragic $39,039 |
| Spanish Americans | 0.5 /100 | #265 | Tragic $39,012 |
| Salvadorans | 0.5 /100 | #266 | Tragic $38,858 |
Demographics Similar to Immigrants from Dominican Republic by Per Capita Income
In terms of per capita income, the demographic groups most similar to Immigrants from Dominican Republic are Indonesian ($37,300, a difference of 0.020%), Haitian ($37,289, a difference of 0.040%), Immigrants from Caribbean ($37,254, a difference of 0.14%), Cuban ($37,383, a difference of 0.21%), and Mexican American Indian ($37,407, a difference of 0.27%).
| Demographics | Rating | Rank | Per Capita Income |
| Blackfeet | 0.1 /100 | #288 | Tragic $37,695 |
| U.S. Virgin Islanders | 0.1 /100 | #289 | Tragic $37,589 |
| Immigrants | Guatemala | 0.1 /100 | #290 | Tragic $37,550 |
| Cajuns | 0.1 /100 | #291 | Tragic $37,527 |
| Immigrants | Micronesia | 0.1 /100 | #292 | Tragic $37,464 |
| Mexican American Indians | 0.1 /100 | #293 | Tragic $37,407 |
| Cubans | 0.1 /100 | #294 | Tragic $37,383 |
| Immigrants | Dominican Republic | 0.1 /100 | #295 | Tragic $37,306 |
| Indonesians | 0.1 /100 | #296 | Tragic $37,300 |
| Haitians | 0.1 /100 | #297 | Tragic $37,289 |
| Immigrants | Caribbean | 0.1 /100 | #298 | Tragic $37,254 |
| Cherokee | 0.1 /100 | #299 | Tragic $37,203 |
| Immigrants | Bahamas | 0.1 /100 | #300 | Tragic $37,193 |
| Ottawa | 0.1 /100 | #301 | Tragic $37,101 |
| Shoshone | 0.1 /100 | #302 | Tragic $37,072 |