Malaysian vs Native/Alaskan Median Household Income
COMPARE
Malaysian
Native/Alaskan
Median Household Income
Median Household Income Comparison
Malaysians
Natives/Alaskans
$81,064
MEDIAN HOUSEHOLD INCOME
7.0/ 100
METRIC RATING
224th/ 347
METRIC RANK
$67,879
MEDIAN HOUSEHOLD INCOME
0.0/ 100
METRIC RATING
331st/ 347
METRIC RANK
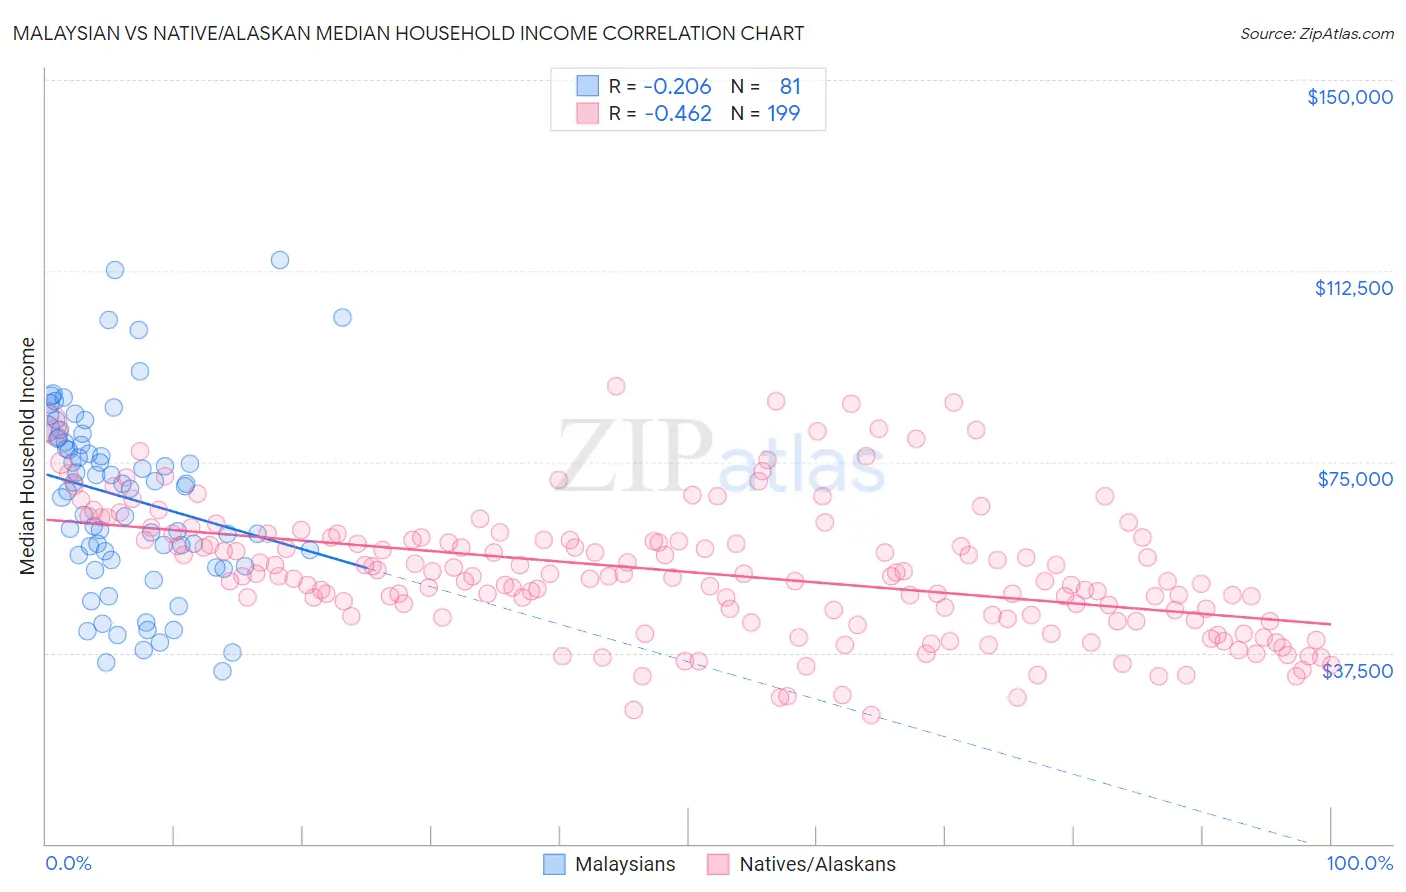
Malaysian vs Native/Alaskan Median Household Income Correlation Chart
The statistical analysis conducted on geographies consisting of 225,962,750 people shows a weak negative correlation between the proportion of Malaysians and median household income in the United States with a correlation coefficient (R) of -0.206 and weighted average of $81,064. Similarly, the statistical analysis conducted on geographies consisting of 512,383,553 people shows a moderate negative correlation between the proportion of Natives/Alaskans and median household income in the United States with a correlation coefficient (R) of -0.462 and weighted average of $67,879, a difference of 19.4%.
Median Household Income Correlation Summary
| Measurement | Malaysian | Native/Alaskan |
| Minimum | $33,804 | $25,291 |
| Maximum | $114,680 | $89,884 |
| Range | $80,876 | $64,593 |
| Mean | $68,008 | $53,343 |
| Median | $70,094 | $52,617 |
| Interquartile 25% (IQ1) | $56,150 | $44,793 |
| Interquartile 75% (IQ3) | $79,730 | $60,078 |
| Interquartile Range (IQR) | $23,581 | $15,285 |
| Standard Deviation (Sample) | $17,902 | $12,918 |
| Standard Deviation (Population) | $17,791 | $12,886 |
Similar Demographics by Median Household Income
Demographics Similar to Malaysians by Median Household Income
In terms of median household income, the demographic groups most similar to Malaysians are Scotch-Irish ($80,972, a difference of 0.11%), Immigrants from El Salvador ($81,213, a difference of 0.18%), Immigrants from Nigeria ($81,236, a difference of 0.21%), Immigrants from Panama ($80,873, a difference of 0.24%), and Guyanese ($80,734, a difference of 0.41%).
| Demographics | Rating | Rank | Median Household Income |
| Ecuadorians | 12.5 /100 | #217 | Poor $82,070 |
| Whites/Caucasians | 12.2 /100 | #218 | Poor $82,029 |
| Nigerians | 10.3 /100 | #219 | Poor $81,725 |
| Immigrants | Venezuela | 9.0 /100 | #220 | Tragic $81,506 |
| Immigrants | Ghana | 9.0 /100 | #221 | Tragic $81,489 |
| Immigrants | Nigeria | 7.7 /100 | #222 | Tragic $81,236 |
| Immigrants | El Salvador | 7.6 /100 | #223 | Tragic $81,213 |
| Malaysians | 7.0 /100 | #224 | Tragic $81,064 |
| Scotch-Irish | 6.6 /100 | #225 | Tragic $80,972 |
| Immigrants | Panama | 6.2 /100 | #226 | Tragic $80,873 |
| Guyanese | 5.7 /100 | #227 | Tragic $80,734 |
| Immigrants | Bangladesh | 5.7 /100 | #228 | Tragic $80,722 |
| Delaware | 5.0 /100 | #229 | Tragic $80,527 |
| Bermudans | 4.7 /100 | #230 | Tragic $80,406 |
| Trinidadians and Tobagonians | 4.7 /100 | #231 | Tragic $80,402 |
Demographics Similar to Natives/Alaskans by Median Household Income
In terms of median household income, the demographic groups most similar to Natives/Alaskans are Arapaho ($67,965, a difference of 0.13%), Sioux ($67,792, a difference of 0.13%), Creek ($67,715, a difference of 0.24%), Black/African American ($67,573, a difference of 0.45%), and Dutch West Indian ($68,412, a difference of 0.79%).
| Demographics | Rating | Rank | Median Household Income |
| Yup'ik | 0.0 /100 | #324 | Tragic $69,695 |
| Seminole | 0.0 /100 | #325 | Tragic $69,420 |
| Yuman | 0.0 /100 | #326 | Tragic $68,743 |
| Immigrants | Cuba | 0.0 /100 | #327 | Tragic $68,461 |
| Menominee | 0.0 /100 | #328 | Tragic $68,423 |
| Dutch West Indians | 0.0 /100 | #329 | Tragic $68,412 |
| Arapaho | 0.0 /100 | #330 | Tragic $67,965 |
| Natives/Alaskans | 0.0 /100 | #331 | Tragic $67,879 |
| Sioux | 0.0 /100 | #332 | Tragic $67,792 |
| Creek | 0.0 /100 | #333 | Tragic $67,715 |
| Blacks/African Americans | 0.0 /100 | #334 | Tragic $67,573 |
| Cheyenne | 0.0 /100 | #335 | Tragic $66,974 |
| Immigrants | Congo | 0.0 /100 | #336 | Tragic $66,768 |
| Kiowa | 0.0 /100 | #337 | Tragic $65,914 |
| Immigrants | Yemen | 0.0 /100 | #338 | Tragic $65,194 |