Malaysian vs Eastern European Median Earnings
COMPARE
Malaysian
Eastern European
Median Earnings
Median Earnings Comparison
Malaysians
Eastern Europeans
$43,844
MEDIAN EARNINGS
2.6/ 100
METRIC RATING
249th/ 347
METRIC RANK
$55,084
MEDIAN EARNINGS
100.0/ 100
METRIC RATING
17th/ 347
METRIC RANK
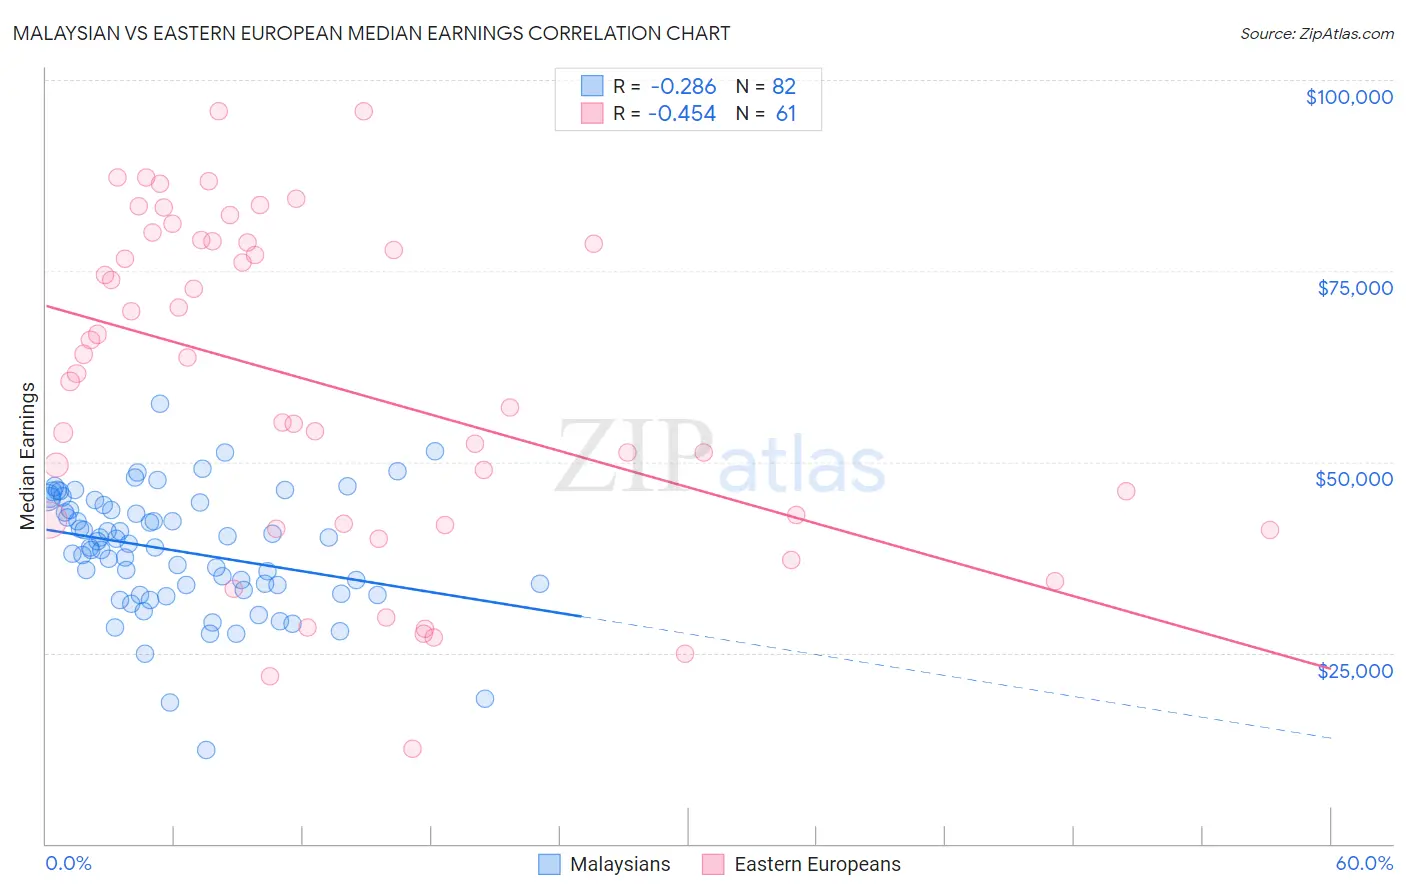
Malaysian vs Eastern European Median Earnings Correlation Chart
The statistical analysis conducted on geographies consisting of 226,109,286 people shows a weak negative correlation between the proportion of Malaysians and median earnings in the United States with a correlation coefficient (R) of -0.286 and weighted average of $43,844. Similarly, the statistical analysis conducted on geographies consisting of 461,197,031 people shows a moderate negative correlation between the proportion of Eastern Europeans and median earnings in the United States with a correlation coefficient (R) of -0.454 and weighted average of $55,084, a difference of 25.6%.
Median Earnings Correlation Summary
| Measurement | Malaysian | Eastern European |
| Minimum | $12,196 | $12,500 |
| Maximum | $57,662 | $95,935 |
| Range | $45,466 | $83,435 |
| Mean | $38,334 | $59,916 |
| Median | $39,047 | $61,581 |
| Interquartile 25% (IQ1) | $33,295 | $41,817 |
| Interquartile 75% (IQ3) | $44,277 | $78,787 |
| Interquartile Range (IQR) | $10,982 | $36,970 |
| Standard Deviation (Sample) | $7,931 | $21,428 |
| Standard Deviation (Population) | $7,883 | $21,251 |
Similar Demographics by Median Earnings
Demographics Similar to Malaysians by Median Earnings
In terms of median earnings, the demographic groups most similar to Malaysians are Nepalese ($43,860, a difference of 0.040%), Alaska Native ($43,750, a difference of 0.22%), Immigrants from Cabo Verde ($43,963, a difference of 0.27%), Immigrants from West Indies ($43,989, a difference of 0.33%), and Tsimshian ($43,695, a difference of 0.34%).
| Demographics | Rating | Rank | Median Earnings |
| Immigrants | Venezuela | 4.0 /100 | #242 | Tragic $44,163 |
| Sub-Saharan Africans | 3.7 /100 | #243 | Tragic $44,118 |
| Immigrants | Nonimmigrants | 3.7 /100 | #244 | Tragic $44,117 |
| Immigrants | Burma/Myanmar | 3.2 /100 | #245 | Tragic $43,998 |
| Immigrants | West Indies | 3.1 /100 | #246 | Tragic $43,989 |
| Immigrants | Cabo Verde | 3.0 /100 | #247 | Tragic $43,963 |
| Nepalese | 2.6 /100 | #248 | Tragic $43,860 |
| Malaysians | 2.6 /100 | #249 | Tragic $43,844 |
| Alaska Natives | 2.3 /100 | #250 | Tragic $43,750 |
| Tsimshian | 2.1 /100 | #251 | Tragic $43,695 |
| Hawaiians | 2.0 /100 | #252 | Tragic $43,673 |
| Somalis | 1.8 /100 | #253 | Tragic $43,567 |
| Liberians | 1.7 /100 | #254 | Tragic $43,536 |
| Immigrants | Middle Africa | 1.4 /100 | #255 | Tragic $43,416 |
| Alaskan Athabascans | 1.4 /100 | #256 | Tragic $43,393 |
Demographics Similar to Eastern Europeans by Median Earnings
In terms of median earnings, the demographic groups most similar to Eastern Europeans are Immigrants from Japan ($54,938, a difference of 0.26%), Immigrants from Belgium ($54,679, a difference of 0.74%), Cypriot ($54,589, a difference of 0.91%), Burmese ($54,559, a difference of 0.96%), and Immigrants from Korea ($54,530, a difference of 1.0%).
| Demographics | Rating | Rank | Median Earnings |
| Immigrants | South Central Asia | 100.0 /100 | #10 | Exceptional $57,114 |
| Immigrants | Israel | 100.0 /100 | #11 | Exceptional $57,034 |
| Immigrants | Ireland | 100.0 /100 | #12 | Exceptional $56,854 |
| Immigrants | China | 100.0 /100 | #13 | Exceptional $56,638 |
| Immigrants | Australia | 100.0 /100 | #14 | Exceptional $56,305 |
| Indians (Asian) | 100.0 /100 | #15 | Exceptional $56,253 |
| Immigrants | Eastern Asia | 100.0 /100 | #16 | Exceptional $56,183 |
| Eastern Europeans | 100.0 /100 | #17 | Exceptional $55,084 |
| Immigrants | Japan | 100.0 /100 | #18 | Exceptional $54,938 |
| Immigrants | Belgium | 100.0 /100 | #19 | Exceptional $54,679 |
| Cypriots | 100.0 /100 | #20 | Exceptional $54,589 |
| Burmese | 100.0 /100 | #21 | Exceptional $54,559 |
| Immigrants | Korea | 100.0 /100 | #22 | Exceptional $54,530 |
| Immigrants | Sweden | 100.0 /100 | #23 | Exceptional $54,478 |
| Soviet Union | 100.0 /100 | #24 | Exceptional $54,290 |